1. Defining Bullish RSI Divergence
.png)
To fully appreciate the value of bullish RSI divergence, it’s essential to first understand its core concept and how it functions within the RSI framework.
1.1. What is Bullish RSI Divergence?
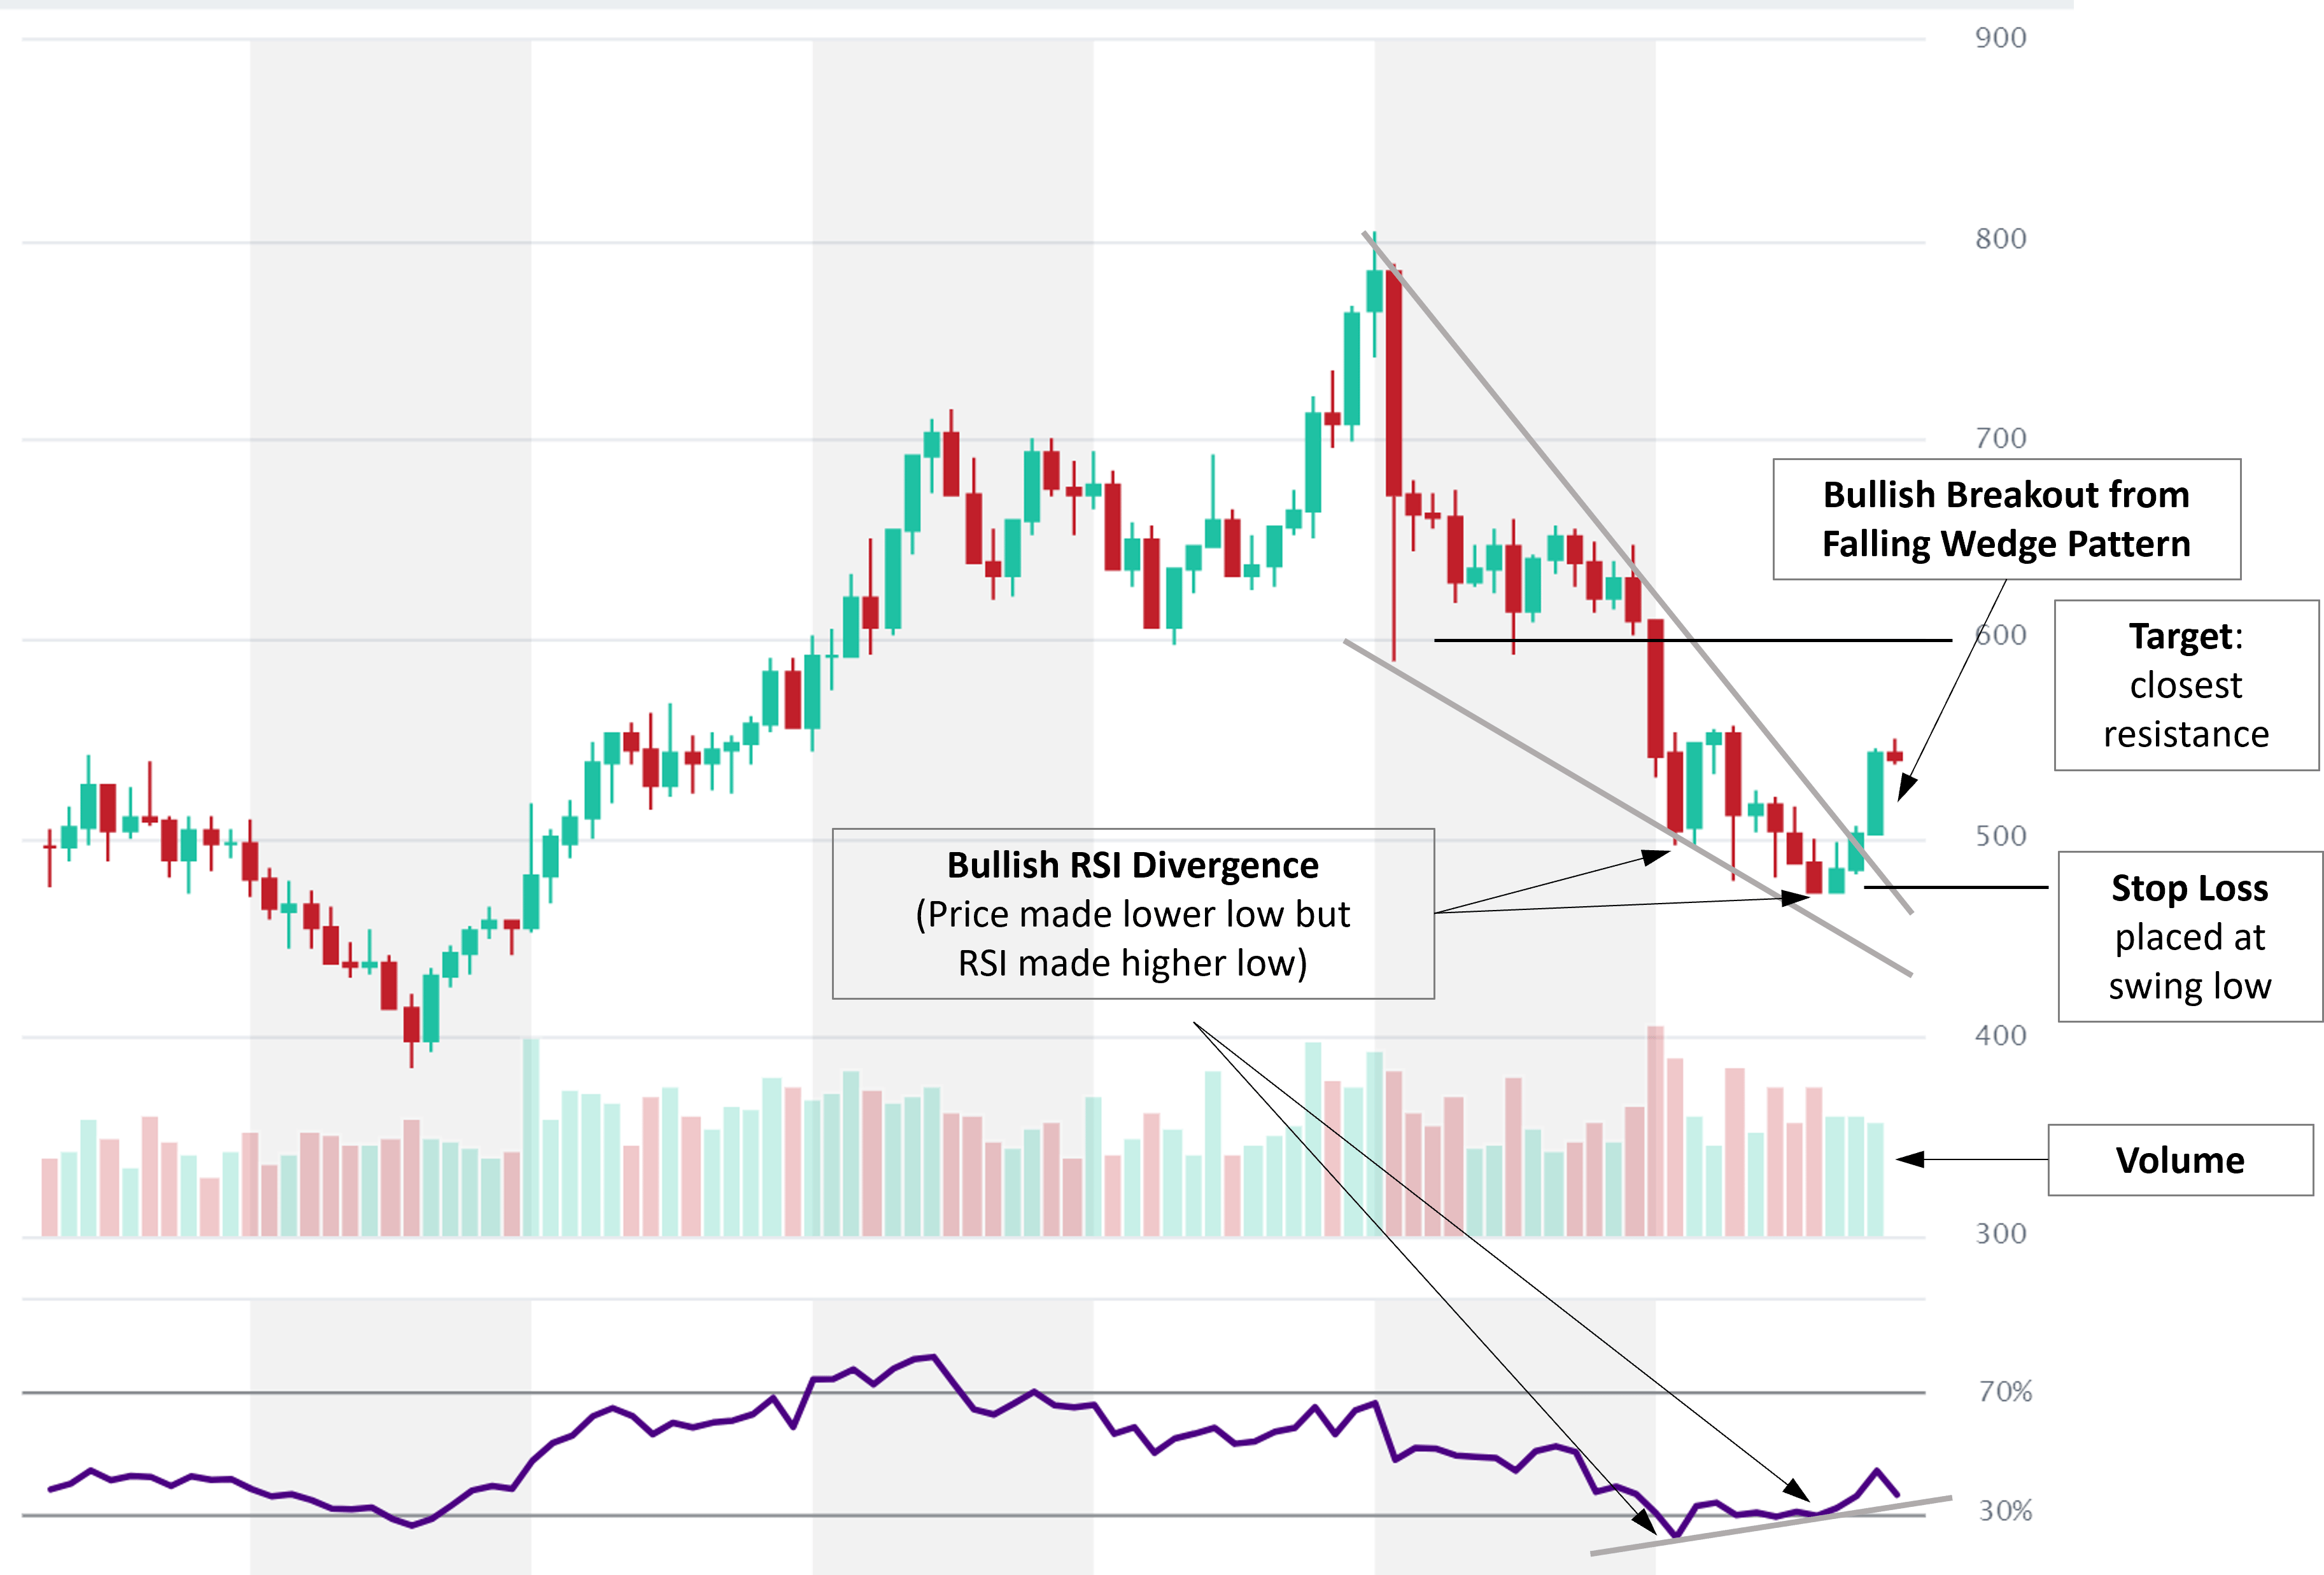
Bullish RSI divergence occurs when the price of an asset forms lower lows (indicating a continued downtrend), while the RSI simultaneously creates higher lows. This discrepancy indicates that, despite falling prices, selling pressure is waning, suggesting that a reversal or upward trend might be on the horizon. According to Investopedia, RSI is a momentum oscillator with values ranging from 0 to 100, typically calculated over a 14-period timeframe. RSI readings below 30 indicate oversold conditions, while readings above 70 suggest overbought conditions. Bullish divergence signals that despite falling prices, the momentum driving the decline is weakening, offering traders a potential opportunity to anticipate a reversal.
1.2. How Bullish RSI Divergence works
The mechanics behind bullish RSI divergence are rooted in the RSI's formula and its sensitivity to price changes:
-
RSI Calculation: The formula used to calculate RSI is:
RSI = 100 - [100 / (1 + RS)],
where RS (Relative Strength) represents the average gain of up periods divided by the average loss of down periods over 14 periods.
Values below 30 typically indicate oversold conditions, while values above 70 suggest overbought conditions. -
Divergence Formation: Divergence forms when the price makes a new low (e.g., $50 to $45), but the RSI rises (e.g., from 25 to 28), suggesting a reduction in selling pressure, according to TradingView’s technical guide. This misalignment between price movement and RSI momentum is the essence of bullish divergence, often indicating the exhaustion of the downtrend.
2. Identifying and Confirming Bullish RSI Divergence

Knowing the definition of bullish RSI divergence is the first step, but the ability to accurately identify and confirm this pattern is essential for successful trading. This section outlines how to spot bullish divergence and the key techniques for confirming its reliability.
2.1. How to Identify Bullish RSI Divergence
Identifying bullish RSI divergence requires a systematic approach:
-
Chart Setup: Use a price chart (daily or hourly) alongside an RSI indicator, typically set to 14 periods, as recommended by StockCharts.com. Platforms like TradingView or MetaTrader can easily facilitate this setup.
-
Spotting the Divergence: Look for two successive price lows, where the second low is lower than the first (e.g., $100 to $95). Simultaneously, the RSI should form higher lows (e.g., 20 to 25). The divergence is particularly meaningful when the RSI is in oversold territory (below 30), as noted by Investopedia.
-
Timeframe Considerations: The strength of divergence varies by the timeframe used. Longer timeframes (such as weekly charts) tend to indicate stronger potential reversals, while shorter timeframes (like 15-minute charts) are more suited to day traders, according to Fidelity’s technical analysis resources.
2.2. Confirmation Techniques
Because false signals can occur, confirmation is a vital part of the process:
-
Volume Analysis: If volume increases alongside the divergence, it strengthens the signal, indicating that buyer interest is growing, as StockCharts.com suggests.
-
Candlestick Patterns: Reversal candlestick patterns, such as a hammer or engulfing pattern, at the second low add reliability to the divergence, according to Investopedia.
-
Additional Indicators: The use of other indicators, such as the MACD (showing a bullish crossover) or moving averages, can help confirm the divergence and enhance the reliability of the trade setup, as per TradingView’s best practices.
3. Practical Applications in Trading

Once bullish RSI divergence has been identified and confirmed, the next step is to explore how traders can use this information in real-world scenarios.
3.1. Entry and Exit Strategies
Bullish RSI divergence can help traders determine the best entry and exit points:
-
Entry: Traders typically enter long positions after confirmation, such as a price breakout above a resistance level following the divergence (e.g., a break above $100 after RSI divergence). According to StockCharts.com, waiting for the RSI to exit oversold conditions (above 30) can help avoid false positives.
-
Exit: Exit targets can be set at prior resistance levels or Fibonacci retracement points. Stop-loss orders should be placed below the second low (e.g., if the second low is $95, the stop-loss could be at $94), as recommended by Fidelity’s trading strategies.
3.2. Asset Classes and Market Contexts
Bullish RSI divergence is versatile and can be applied across various asset classes and market conditions:
-
Stocks: In 2025, bullish divergence in stocks like NVIDIA signals potential rebounds following sell-offs, demonstrating the broad applicability of the RSI indicator in diverse markets.
-
Cryptocurrencies: In highly volatile markets like cryptocurrencies, bullish divergence in assets such as Bitcoin could flag a reversal from $85,000 to $90,000, as seen in early 2025, according to CoinGecko. Traders can exploit this pattern for profitable opportunities in crypto markets.
-
Bearish Markets: In downtrends, bullish RSI divergence is particularly valuable for identifying market bottoms where momentum is shifting, a key strategy in TradingView’s crypto guides.
4. Implications and Limitations of Bullish RSI Divergence

While bullish RSI divergence can be a powerful tool, it is important to understand its limitations and the risks associated with relying solely on this indicator.
4.1. Trading Implications
-
Early Warning Signal: Bullish RSI divergence can serve as an early warning of a potential reversal, giving traders a significant edge in predicting market movements before they fully materialize, as noted by StockCharts.com.
-
Market Sentiment: In 2025, the widespread use of automated trading bots on platforms like Binance can intensify price movements, potentially accelerating reversals as traders react simultaneously to divergence patterns, according to CoinDesk’s 2024 report on algorithmic trading.
4.2. Limitations and Risks
-
False Signals: Divergence can sometimes persist without leading to a reversal, particularly in strong downtrends. For instance, a stock may drop from $50 to $40 despite the RSI rising from 20 to 25, as Investopedia cautions.
-
Lagging Nature: Since RSI is based on past price data, it can be slow to respond to rapid price movements, especially in fast-paced markets like cryptocurrencies, which can reduce its effectiveness, according to TradingView.
-
Context Dependency: RSI divergence should not be relied upon in isolation. Without additional confirmation from other indicators or price patterns, it can be unreliable, a pitfall highlighted by Fidelity for less experienced traders.
5. Conclusion
Bullish RSI divergence remains a cornerstone of technical analysis, providing traders with valuable insights into potential momentum shifts in both traditional markets and more volatile sectors like cryptocurrencies. While not foolproof—susceptible to false signals and lagging in fast markets—bullish RSI divergence serves as an essential tool for disciplined traders.
By carefully identifying the divergence, confirming it with additional indicators, and applying it with sound risk management strategies, traders can gain a deeper understanding of market behavior and increase their chances of identifying profitable opportunities.
In an era increasingly driven by data and algorithmic trading, bullish RSI divergence offers a lens through which market trends can be better understood, bridging past price actions with future potential.
Read more:

 English
 Tiếng Việt
.png)

.jpg)
.jpg)
.jpg)

.jpg)
.jpg)

.jpg)
.jpg)
.jpg)
.jpg)


