.jpg)
1. The Issue with price delays in Traditional Moving Averages
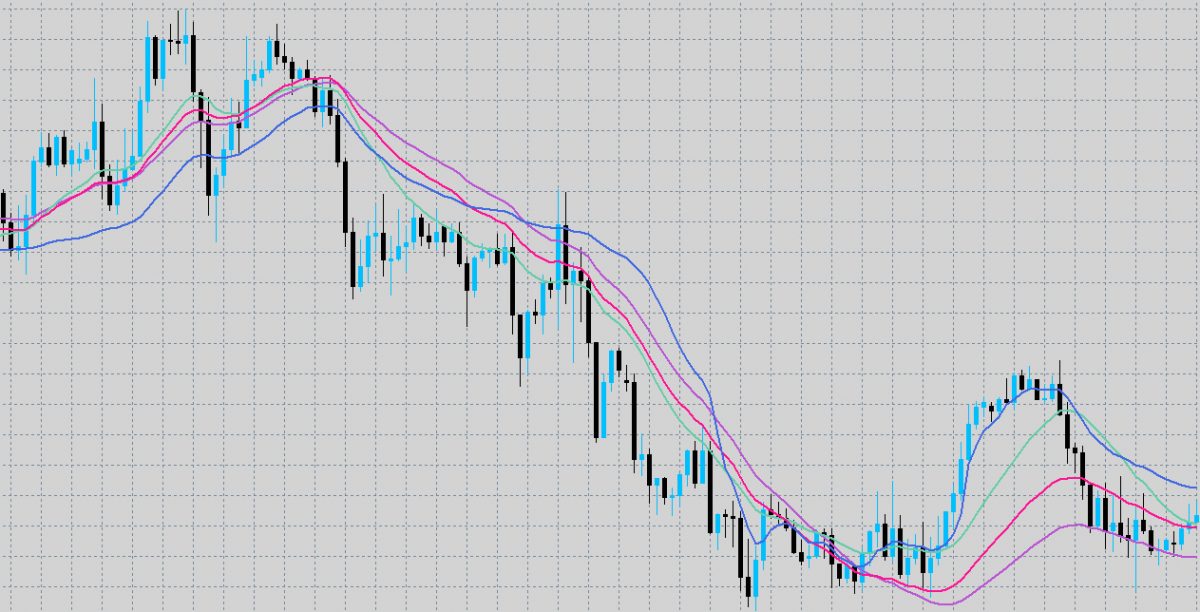
Traditional Moving Averages, like the Simple Moving Average (SMA) and Exponential Moving Average (EMA), are commonly used for smoothing price data and identifying trends. However, these MAs tend to react slowly to changes in price, which can lead to delayed trading signals.
To better understand this lag, let’s consider a stock's closing prices over 10 days:
| Day | Price (₹) |
| 1 | 100 |
| 2 | 98 |
| 3 | 97 |
| 4 | 102 |
| 5 | 101 |
| 6 | 103 |
| 7 | 99 |
| 8 | 95 |
| 9 | 98 |
| 10 | 104 |
The Simple Moving Average (SMA) for these prices is calculated by summing the values and dividing by the number of days (10), resulting in an SMA of ₹99.70. If the price increases sharply to ₹110 on day 11, the new SMA would be ₹100.70. Despite the significant price increase, the SMA responds slowly, reflecting the lag in traditional MAs.
2. What is the Hull Moving Average (HMA)?
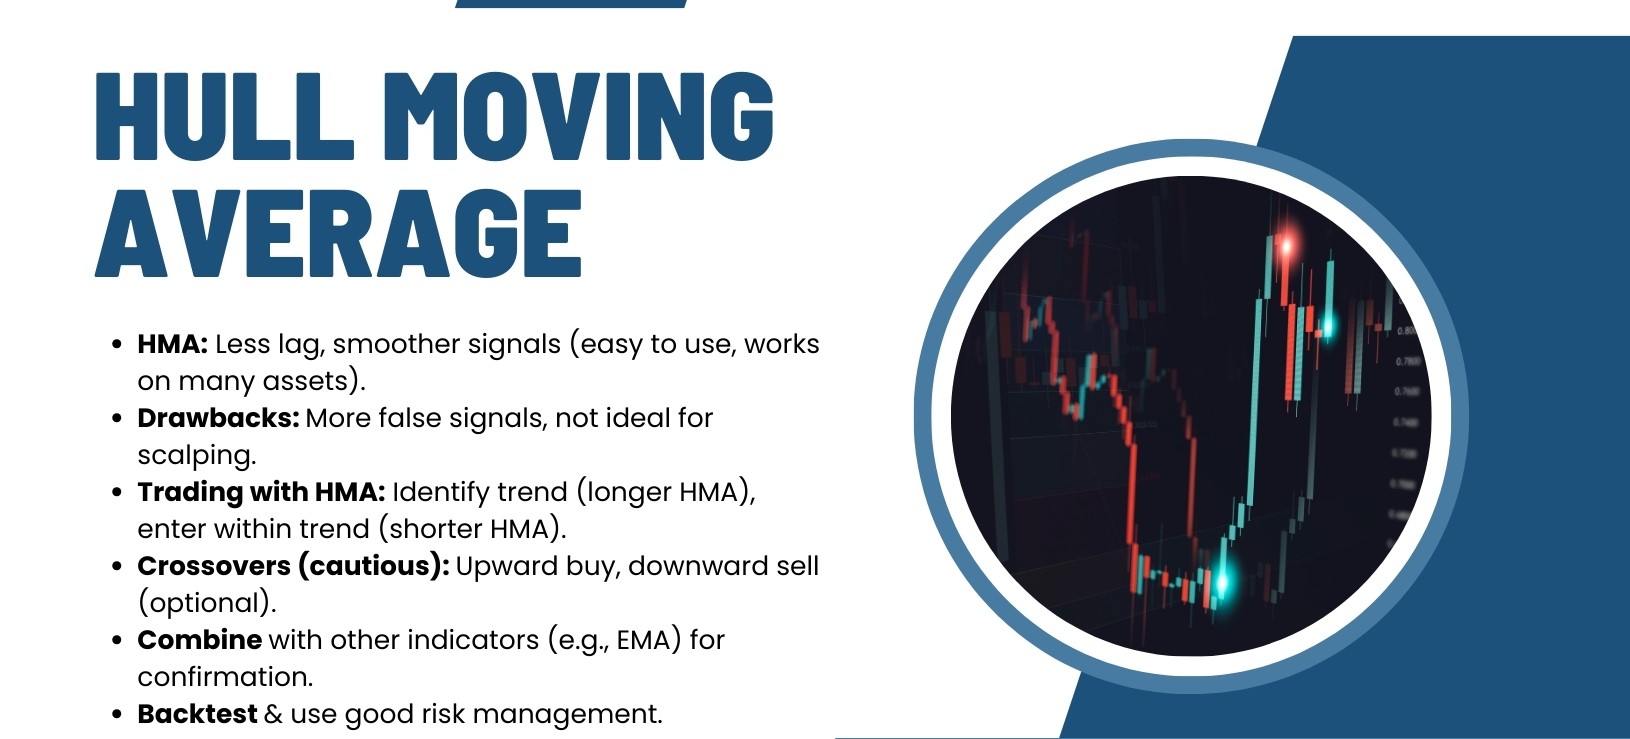
The Hull Moving Average (HMA), developed by Alan Hull in 2005, is designed to reduce the lag seen in traditional moving averages while maintaining smoothness. It enables traders to respond more quickly to market changes, capturing trends with greater accuracy and effectiveness.
The HMA helps traders identify:
-
The direction in which a stock or security’s price is moving
-
The magnitude of the price movement
This enhanced responsiveness allows for more informed decisions on when to enter or exit a trade and how to set stop-loss levels.
Unlike traditional MAs that treat all data points equally, the HMA gives more weight to recent prices, which makes it more responsive to market shifts. As a result, the HMA provides a clearer and more precise depiction of price trends.
The HMA addresses the lag issue in traditional MAs through a two-step approach, involving two Weighted Moving Averages (WMAs)—one for a longer period and another for a shorter period. The longer-period WMA helps smooth out price fluctuations, while the shorter-period WMA ensures the indicator is more responsive to recent price changes.
3. Understanding the Hull Moving Average Mathematics
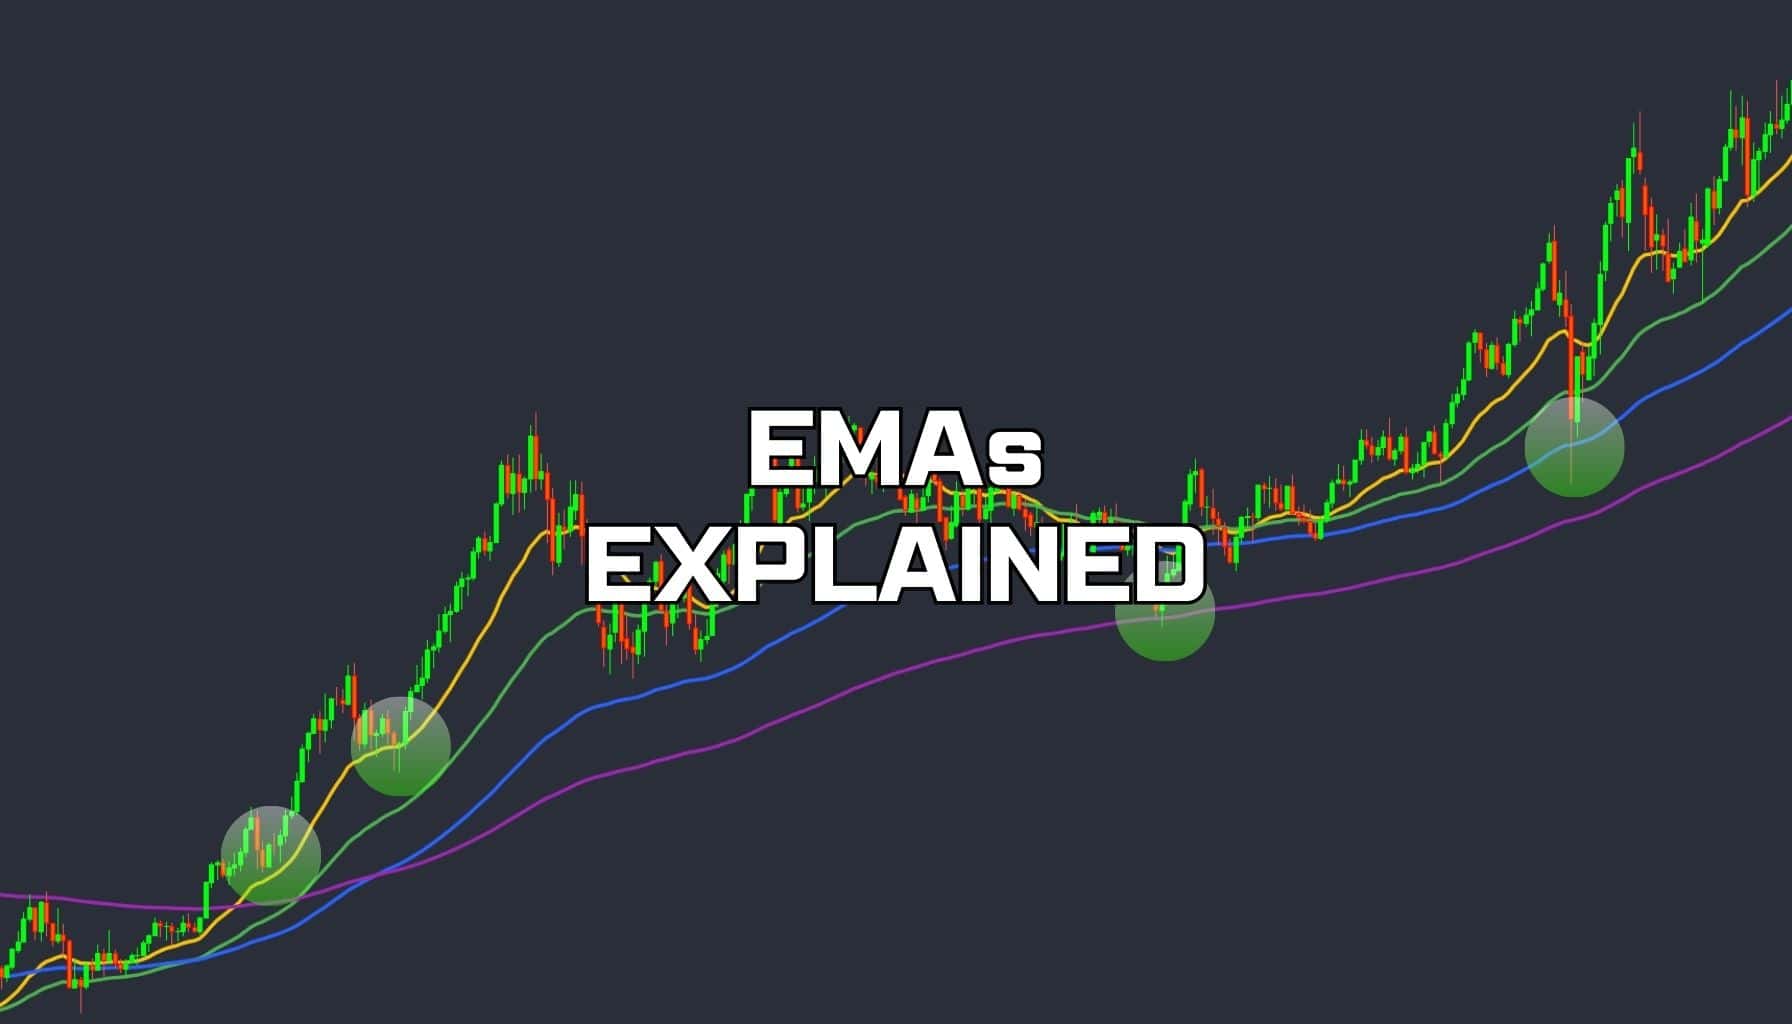
The HMA uses a sophisticated formula based on weighted moving averages to offer an accurate reflection of price trends. Here is a breakdown of how to calculate it:
-
WMA Calculation: The Weighted Moving Average (WMA) for a given period "n" is calculated as follows:
-
Half-Period WMA: Calculate the WMA for half the period, denoted as WMA(n/2).
-
Full-Period WMA: Calculate the WMA for the full period, WMA(n).
-
Intermediate Value: The intermediate value is computed as:
IntermediateValue=2×WMA(n/2)−WMA(n)Intermediate Value = 2 \times WMA(n/2) - WMA(n) -
Final HMA Calculation: Apply the WMA to the intermediate value over the square root of the period:
HMA(n)=WMA(n) of the Intermediate ValueHMA(n) = WMA(\sqrt) \text{ of the Intermediate Value} -
This formula reduces lag and provides a smoother indicator that is more responsive to recent price movements.
4. Setting Up the Hull Moving Average
.jpg)
To set up the HMA in your trading strategy, you need to consider a few key factors:
-
Choosing the Right Time Frame: The time frame you select depends on your trading style. Short-term traders might use 5-minute or 15-minute charts, while long-term traders might prefer daily or weekly charts.
-
Selecting the Right Moving Average Period: The period of the moving average affects the HMA’s sensitivity to price changes. Short periods (e.g., 9 or 12) are more responsive and suitable for short-term traders, while longer periods (e.g., 20 or 50) offer a broader market perspective for long-term traders.
-
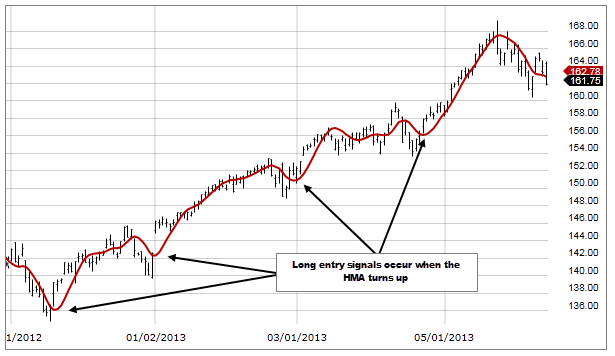
Interpreting the HMA Line: The HMA line provides valuable signals. A rising HMA typically indicates a bullish trend, while a falling HMA suggests a bearish market. A flat HMA usually signifies market consolidation or uncertainty.
5. Different Strategies for using HMA
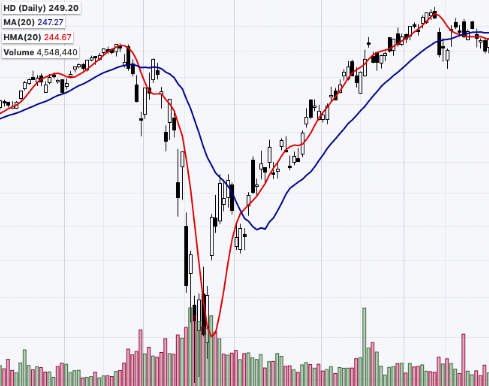
Traders can implement several strategies using the Hull Moving Average to improve their decision-making process:
-
Trend Following: If the HMA is rising, it signals an uptrend, suggesting a buying opportunity. Conversely, a falling HMA indicates a downtrend and a potential sell.
-
Filter Trading: The HMA can be used to filter out false signals caused by market noise. Setting a threshold above or below the HMA helps distinguish valid market movements from random fluctuations.
-
Divergence Trading: If the HMA diverges from the price action (e.g., prices are reaching new highs but the HMA is not following), it might indicate that the current trend is weakening, signaling a potential reversal.
-
HMA Crossover: Watch for crossovers between short-term and long-term HMAs. A short-term HMA crossing above a long-term HMA suggests a buying opportunity, while a crossover below signals a potential sell.
-
HMA Breakout: This strategy focuses on price movements beyond established support or resistance levels. A breakout above the HMA could indicate a strong upward trend, while a drop below might suggest a selling opportunity.
6. HMA: Benefits and Drawbacks
Benefits of the HMA:
-
Quick to react to recent price changes
-
Smooths out price fluctuations effectively
-
Versatile for different time frames and trading styles
-
Easy to interpret and apply to various strategies
Drawbacks of the HMA:
-
Can sometimes produce misleading signals
-
Sensitive to rapid, short-term price movements
-
Complex for beginners to understand
7. Conclusion
The Hull Moving Average (HMA) is an invaluable tool for traders seeking clearer insights into market trends and price movements. By reducing lag and offering a more responsive, smoother indicator, the HMA helps traders make quicker and more informed decisions. However, like all indicators, it is essential to use the HMA in conjunction with other analysis tools for the most reliable and well-rounded decision-making.
Incorporating the HMA into your trading strategy can enhance your ability to respond to market changes more effectively, but remember to combine it with other indicators to achieve the best results.
Read more:

 English
 Tiếng Việt
.png)
.jpg)

.jpg)
.jpg)

.jpg)
.jpg)

.jpg)
.jpg)
.jpg)
.jpg)


