1. What is RSI?

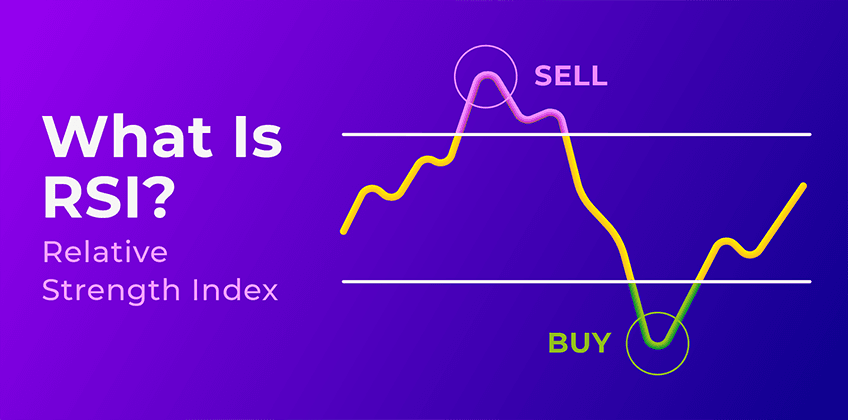
The RSI is a momentum oscillator, meaning it measures the speed and change of price movements. It is designed to identify conditions in the market where an asset’s price might be overbought or oversold, which could signal potential reversals or price corrections.
RSI is typically displayed as a line graph that oscillates between 0 and 100. The default period for calculating RSI is 14 periods, which could represent 14 days, 14 hours, or any other time frame depending on the trader's choice.
2. RSI Calculation
.png)
The formula for calculating the RSI is:
Where:
-
RS (Relative Strength) = The average of the gains during the 14 periods divided by the average of the losses during the same 14 periods.
The RSI value oscillates between 0 and 100, and it is typically used to highlight the strength of a price trend and potential reversal points.
3. RSI Values and what they indicate

RSI readings can be interpreted in various ways depending on their value and the overall market context. Here's how different RSI values are generally interpreted:
-
Overbought (RSI > 70): When the RSI exceeds 70, the asset is considered overbought, meaning the price has risen too quickly, and the asset may be due for a pullback or price correction. Overbought conditions do not necessarily indicate an immediate reversal but rather signal that the asset may be overpriced.
-
Oversold (RSI < 30): When the RSI falls below 30, the asset is considered oversold, meaning the price has fallen too quickly, and the asset may be due for a rebound or upward price movement. Similar to overbought conditions, oversold conditions do not guarantee a reversal but indicate a potential for price correction.
-
Neutral (RSI = 50): An RSI reading around 50 indicates a neutral market, where neither bullish nor bearish momentum is dominant. The market is in a balance between buying and selling pressures.
4. How to Interpret RSI in Trading
.jpg)
4.1. Overbought and Oversold Conditions
One of the main uses of the RSI is to detect overbought and oversold levels. Here’s how traders use these conditions:
-
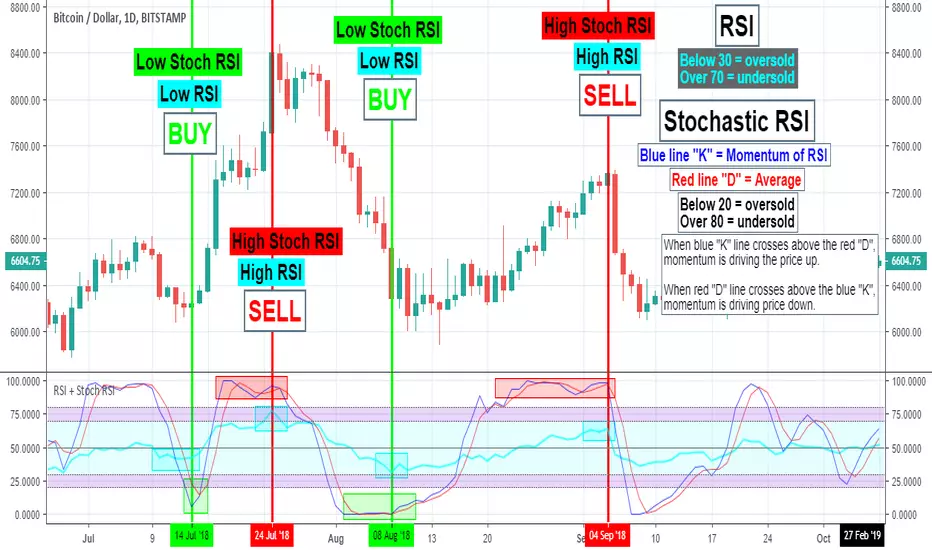
Overbought (RSI > 70): When the RSI is above 70, traders might consider selling or shorting the asset, as the market has become overextended, and a price pullback or correction could occur. However, in strong uptrends, the RSI can remain above 70 for extended periods without reversing immediately, so caution is needed.
-
Oversold (RSI < 30): When the RSI is below 30, traders might look for buying opportunities, as the asset could be undervalued and may experience a price bounce. However, in strong downtrends, the RSI can remain below 30 for prolonged periods, so it is important to wait for confirmation of a reversal.
4.2. RSI in Trending Markets
RSI readings can differ depending on whether the market is trending or ranging:
-
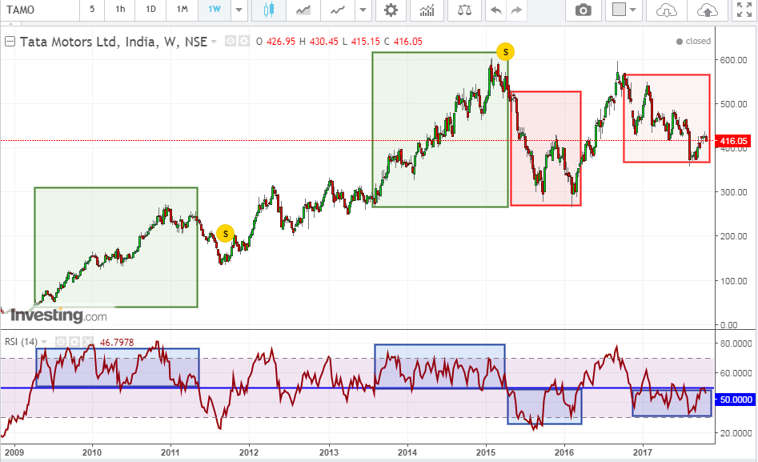
Uptrends: In a strong uptrend, RSI values often stay between 40 and 70. A reading above 70 is considered overbought, but this can occur frequently in a strong uptrend. Traders may not look to sell until the RSI falls back to a more neutral range, such as near 50.
-
Downtrends: In a downtrend, RSI typically stays below 60, and oversold conditions (RSI < 30) may occur more often. Traders might look for potential selling opportunities when the RSI approaches the 50 level, which could indicate weakening bearish momentum.
4.3. Divergence and Convergence
RSI can also help spot divergences, which occur when the price moves in one direction while the RSI moves in the opposite direction. Divergence can indicate a potential trend reversal. Here’s how it works:
-
Bullish Divergence: A bullish divergence occurs when the price forms lower lows, but the RSI forms higher lows. This suggests that although the price is declining, the momentum is weakening, and a potential reversal to the upside could occur.
-
Bearish Divergence: A bearish divergence happens when the price forms higher highs, but the RSI forms lower highs. This indicates that even though the price is rising, the momentum is weakening, and a potential downward reversal could take place.
4.4. Failure Swing
A failure swing is a powerful reversal signal in which the RSI breaks through its own levels of support or resistance. There are two types of failure swings:
-
Bullish Failure Swing: The RSI moves below 30, rises above 30, then drops back below 30 before moving above its previous high. This indicates a potential reversal to the upside.
-
Bearish Failure Swing: The RSI moves above 70, falls below 70, then rises above 70 before dropping below its previous low. This suggests a potential reversal to the downside.
5. Combining RSI with Other Indicators

RSI works well when combined with other technical indicators to confirm or strengthen trading signals. Here are a few ways traders combine RSI with other tools:
-
Moving Averages: Traders often use RSI in conjunction with moving averages. A buy signal could occur when the price is above the moving average and the RSI shows oversold conditions (below 30), while a sell signal might arise when the price is below the moving average and RSI shows overbought conditions (above 70).
-
MACD (Moving Average Convergence Divergence): The MACD is another momentum indicator that can be combined with RSI to confirm trends or reversals. A bullish signal could occur when both the RSI and MACD indicate upward momentum.
-
Support and Resistance Levels: RSI can also be used in combination with traditional support and resistance levels to make more informed decisions. For instance, if the price approaches a key resistance level while the RSI is overbought, it may be a signal to sell.
Conclusion
The Relative Strength Index (RSI) is a versatile and powerful tool for traders seeking to identify potential market reversals, overbought, or oversold conditions. By understanding how to read RSI values and combining them with other technical analysis tools, traders can make more informed decisions, whether they are looking to enter, exit, or hold positions in the market. However, like all technical indicators, RSI should be used in conjunction with other methods of analysis to avoid false signals and improve the accuracy of trading strategies.
Read more:

 English
 Tiếng Việt
.png)
.jpg)
.jpg)
.jpg)
.jpg)

.jpg)
.jpg)

.jpg)
.jpg)
.jpg)
.jpg)


