1. What is a Long-Legged Doji?
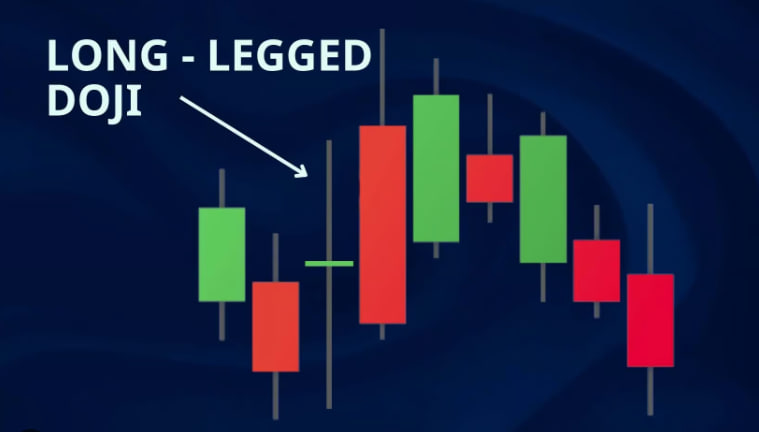
A long-legged Doji is a specific type of Japanese candlestick pattern that reflects market indecision and uncertainty. It features a very small or nearly nonexistent body, with long wicks both above and below the body. A long-legged Doji appears when the opening and closing prices of a trading session are nearly equal, while the highest and lowest prices in the session are significantly far from these points.
The long-legged Doji is a powerful indicator of market hesitation. When it appears, it often suggests a balance between buying and selling forces and can signal a potential reversal in the current trend. This pattern is particularly useful in the volatile cryptocurrency market, where it provides important information to help investors make informed trading decisions.

2. How to Identify a Long-Legged Doji
- Small or No Body: The body of the long-legged Doji is very small or nonexistent, indicating that the opening and closing prices are nearly the same.
- Long Wicks: The upper and lower wicks of the long-legged Doji are very long, showing significant price volatility within the session.
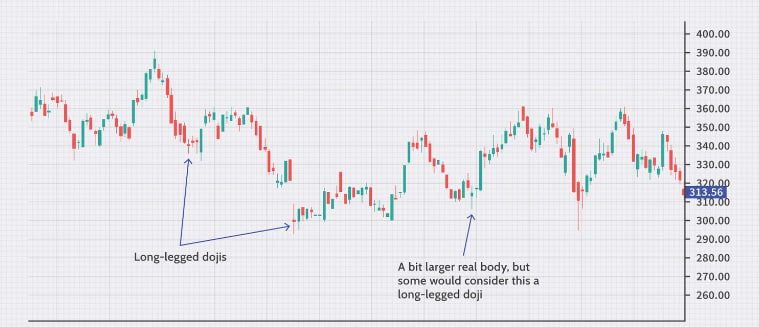
- Position in Trend: The long-legged Doji often appears at the peak or trough of a trend, signaling a potential reversal.
Example of a Long-Legged Doji on a Price Chart:
Imagine you are observing Bitcoin's price chart and notice a long-legged Doji appearing after a series of strong upward candles. This may indicate that the uptrend is weakening and could potentially reverse to a downtrend.
3. Using Long-Legged Doji in Cryptocurrency Trading
- Assessing Market Trends: The long-legged Doji is a helpful tool for evaluating market trends. When it appears in an uptrend, it may signal weakening buying power and a possible reversal to the downside. Conversely, in a downtrend, it may signal waning selling pressure and a potential reversal to the upside.
- Identifying Entry and Exit Points: The long-legged Doji can assist investors in identifying potential entry and exit points. When a long-legged Doji appears after a strong uptrend, you might consider selling to lock in profits. Conversely, if it appears after a strong downtrend, you might consider buying to capitalize on a potential upward reversal.
- Managing Investment Risk: Using the long-legged Doji helps investors manage risk more effectively. By identifying potential reversal points, you can adjust your trading strategy to avoid unnecessary risks and optimize returns.
This pattern can be a valuable component of a trader’s toolkit in navigating the fast-moving world of cryptocurrency.

4. Trading Strategies with Long-Legged Doji Candlesticks
Below are specific strategies for trading with long-legged Doji candlesticks, based on prior uptrends and downtrends.
4.1. When a Long-Legged Doji Appears After an Uptrend
-
Sell Order: When a long-legged Doji appears after a strong uptrend, it can indicate that the market is entering a correction phase. To execute a Sell order, the investor should wait for the next candlestick, often referred to as the confirmation candlestick. If the confirmation candle closes below the low of the Doji, this strengthens the signal to open a Sell position. This close confirms that selling pressure is increasing, which could lead to a more significant price decline.
-
Stop Loss: To protect the position, the investor should set a stop loss above the high of the long-legged Doji. This limits potential losses if the market continues to rise without showing signs of correction.
-
Take Profit: Profit can be taken at key support levels previously identified by the investor. These are often areas where the price may find support and potentially bounce back. By taking profit at these points, the investor can maximize returns on the Sell order.
4.2. When a Long-Legged Doji Appears After a Downtrend
-
Buy Order: If a long-legged Doji appears after a downtrend, it may indicate that the market is poised for a potential upward reversal. To execute a Buy order, the investor should wait for the next candlestick. If the confirmation candle closes above the high of the Doji, this is a strong signal to open a Buy position. A close above this level often signals that buying pressure is increasing, which could lead to a new upward trend.
-
Stop Loss: To protect the trade, the investor should set a stop loss below the low of the long-legged Doji. This minimizes risk if the market does not reverse as expected and continues to decline.
-
Take Profit: Similar to the Sell order scenario, the investor should aim to take profit at significant resistance levels. These are points where the price has previously struggled to break through, and a correction could occur. By identifying these resistance zones, the investor can effectively capitalize on profits from the Buy order.
Using these strategies, traders can better navigate potential reversals and maximize gains while minimizing risks.
5. Comparing Long-Legged Doji Candlestick with Other Doji Types
Each type of Doji has unique characteristics suited to different trading situations. The table below will help you identify and differentiate the features of each Doji type.
| Doji Type | Long-Legged Doji | Standard Doji | Dragonfly Doji | Gravestone Doji | Four-Price Doji |
|---|---|---|---|---|---|
| Shape | Small body, long wicks | Small body, short wicks | Small body, long wick below, short wick above | Small body, long wick above, no wick below | Very small body, no wicks |
| Meaning | Strong reversal signal, showing clear indecision | Shows market uncertainty | Reversal potential, indicates strength of sellers | Reversal signal to the downside, shows selling pressure | Shows indecision at four price levels |
| Trend | Often follows strong trend (up or down) | Prior trend unclear | Prior uptrend, showing signs of weakening | Prior uptrend, potential reversal | Typically appears in sideways markets |
| Next Signal | Needs confirmation candle to enter trade | Needs confirmation candle to determine direction | Needs strong confirmation candle to enter trade | Needs confirmation candle to enter Sell position | Needs confirmation candle for clear decision |
6. Benefits and Limitations of Long-Legged Doji
6.1. Benefits
- Early Reversal Warning: The Long-Legged Doji provides an early warning of a potential trend reversal.
- Easy Identification: Its distinct characteristics make it easy to spot on charts, helping traders quickly determine buy and sell points.
6.2. Limitations
- False Signals: In some cases, the Long-Legged Doji may give false signals, leading to inaccurate trade decisions.
- Not Suitable for All Market Conditions: It may not be effective in highly volatile markets.
7. Tips for Using Long-Legged Doji in Trading
- Combine with Other Technical Indicators: To improve the accuracy of signals, combine the Long-Legged Doji with other indicators like RSI, MACD, and Bollinger Bands.
- Consider Longer Timeframes: Use it on longer timeframes (such as daily or weekly) to avoid false signals and better assess long-term trends.
- Monitor News and Market Events: Stay updated on important news and events related to cryptocurrencies to make more informed trading decisions.
8. Conclusion
The Long-Legged Doji is a powerful technical analysis tool that helps investors identify potential buy and sell points, assess market trends, and manage risk effectively. By understanding and utilizing this candlestick, you can optimize your trading strategy and maximize returns from your cryptocurrency investments.
Read more:

 English
 Tiếng Việt
.jpg)

.jpg)
.jpg)
.jpg)

.jpg)
.jpg)

.jpg)
.jpg)
.jpg)


