English
 Tiếng Việt
1. What is Bearish?
"Bearish" is a term used to describe a downward trend in prices below the historical average of a market or a specific coin/token over a certain period. A bearish market is characterized by selling pressure outweighing buying interest, leading to a price drop of 20% or more over an extended period.
People often describe a bearish market using terms like "negative sentiment," "selling pressure," or "reversal." In the crypto market, it can arise from bad news, economic concerns, or weakness following a previous uptrend. The term carries a negative connotation because it implies a decline in market value, potentially leading to significant losses for investors.
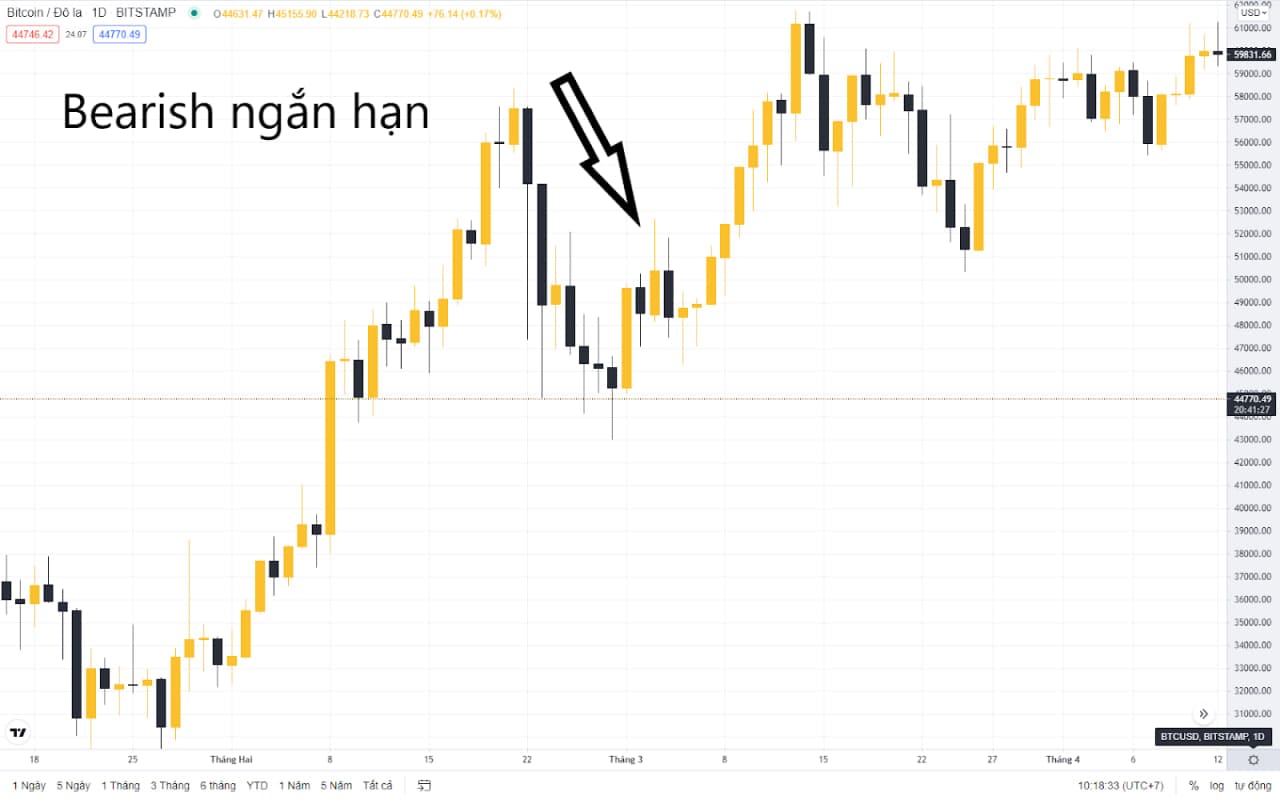
1.1. Short-Term Bearish
Short-term bearish trends occur when an asset's price drops over a brief period, typically a few days or weeks. Short-term factors such as rumors, events, or market volatility can create this bearish situation. In these cases, investors may use short-term strategies to profit from the downturn, such as selling to lock in profits or shorting the market to gain from the decline.
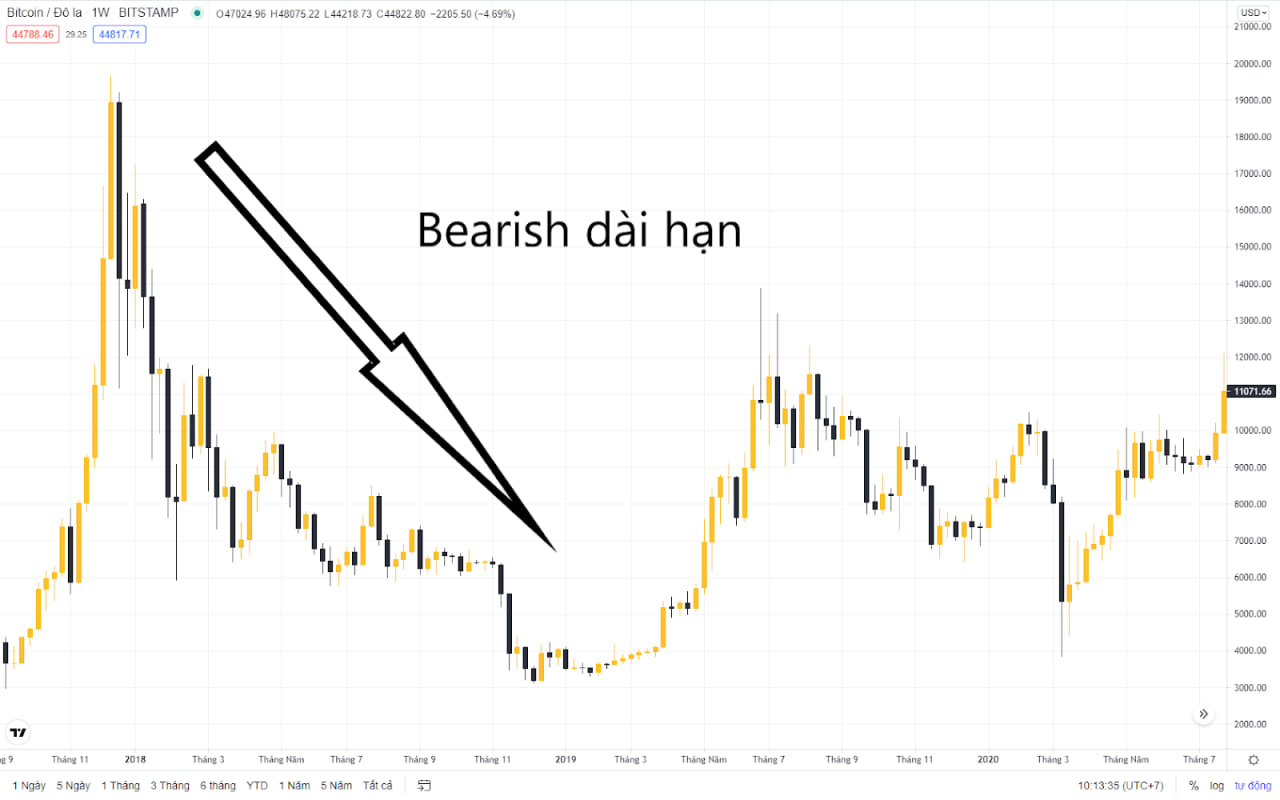
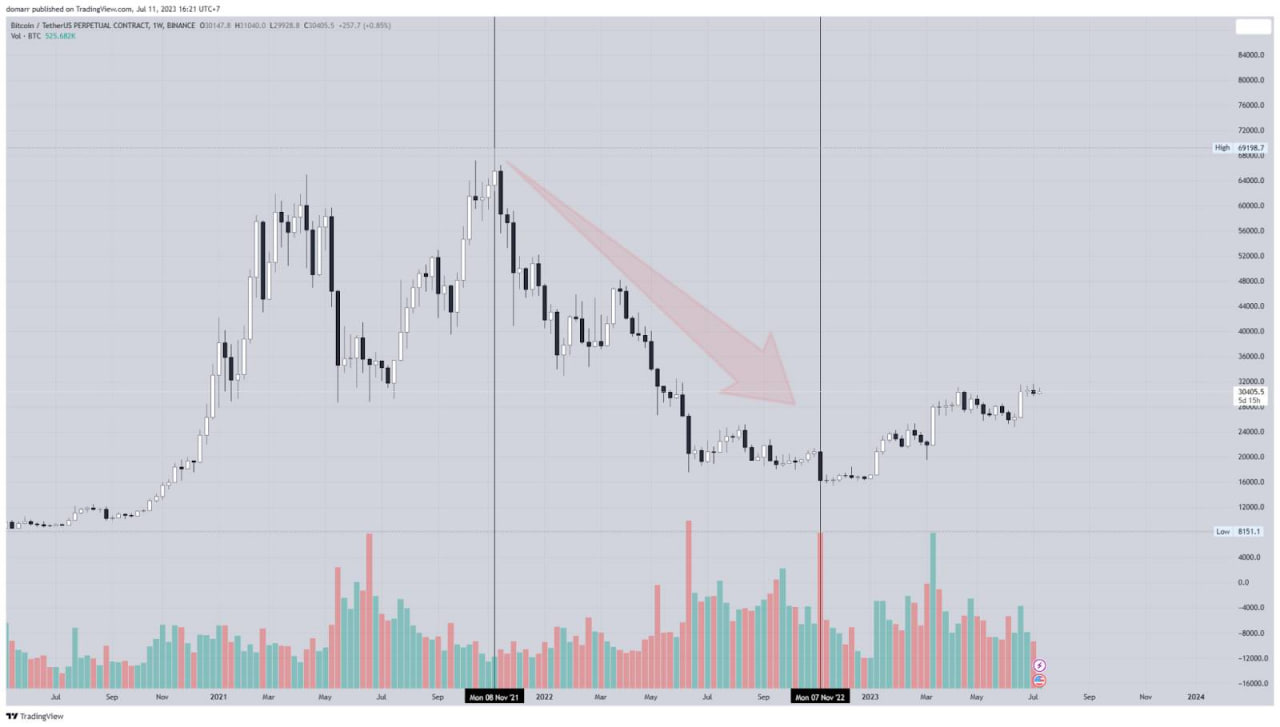
1.2. Long-Term Bearish
Long-term bearish trends describe a prolonged price drop lasting several months to years. Long-term factors like global economic changes, political instability, or structural financial weakness can drive this kind of bearish trend. In such situations, investors may consider shifting their investments to safer assets or reducing exposure to high-risk investments to preserve capital over the long term.
These bearish types each present unique challenges and opportunities, and choosing the right investment strategy depends on an investor's specific goals and expectations.
2. Characteristics of a Bearish Market
-
Continuous Price Declines:
A key characteristic of a bearish market is the continuous decline in asset prices, which may show as a series of red candlesticks on price charts. -
Negative Market Sentiment:
Bearish markets are often accompanied by negative sentiment and concern among investors. Negative rumors, poor economic data, or weakness in market indicators can intensify the bearish mood. -
Increased Volatility:
Market volatility usually rises in bearish conditions. Uncertainty and selling pressure can cause significant price swings, leading to rapid and unpredictable movements. -
Selling Pressure:
Investors tend to sell off assets to secure profits or avoid losses during a bearish market. Increased selling pressure can push prices down further. -
Rising Limit Orders:
Bearish markets may see an increase in sell limit orders, creating resistance levels and enhancing the likelihood of price declines when prices approach those levels. -
Downtrend:
Bearish markets occur during downtrends, where both highs and lows gradually decrease, and support levels may be broken.
Understanding these characteristics can help investors recognize and adapt to bearish market conditions, allowing for more informed investment decisions.
3. Crypto Trading Indicators in a Bearish Market
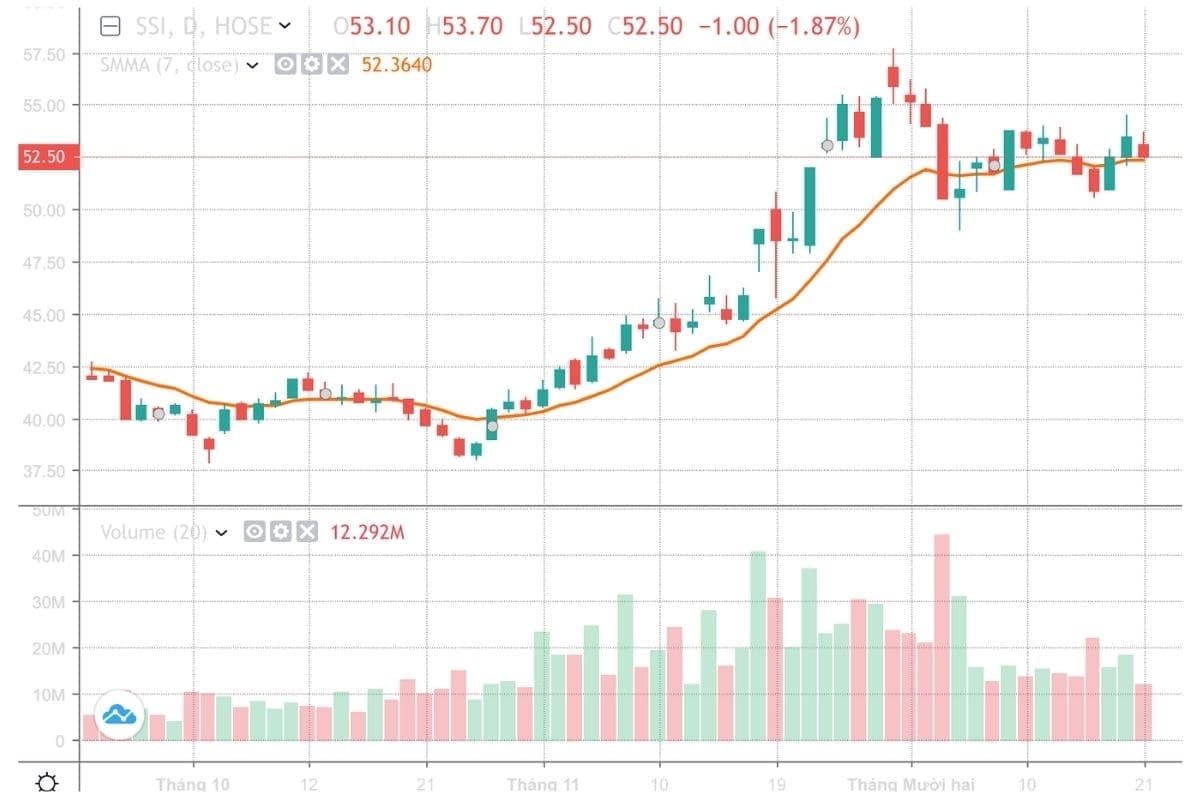
3.1. Moving Averages (MA)
Moving Averages help filter out noise and smooth complex price movements, making it easier to observe market trends. There are two types: Simple Moving Average (SMA) and Exponential Moving Average (EMA). In a downtrend, when a short-term MA crosses below a long-term MA, it often signals a bearish trend.
3.2. Relative Strength Index (RSI)
The Relative Strength Index measures the speed and change of price movements, helping traders identify overbought or oversold conditions that may indicate potential reversals. RSI values above 70 suggest overbought conditions, while values below 30 indicate oversold conditions. In a bearish market, an RSI above 70 may signal selling opportunities.
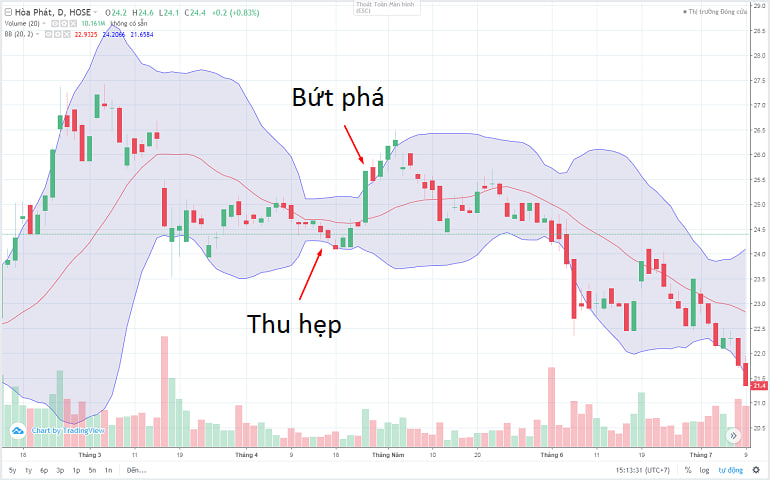
3.3. Bollinger Bands
Bollinger Bands consist of a moving average line surrounded by bands that represent standard deviations above and below the average. These help traders identify periods of high volatility and potential reversals. In a bearish market, prices breaking below the lower band may indicate selling opportunities.
3.4. Moving Average Convergence Divergence (MACD)
MACD is a tool for identifying potential trend changes and momentum shifts. It includes the MACD line and the Signal line, calculated using EMAs. When the MACD line crosses below the Signal line, it generates a bearish signal, indicating a possible downward trend.
3.5. Stochastic Oscillator
The Stochastic Oscillator compares an asset's closing price to its price range over a certain period. It helps traders identify overbought and oversold conditions as well as potential trend reversals. In a bearish market, look for the %K line crossing below the %D line when the oscillator is above 80, signaling potential selling opportunities.
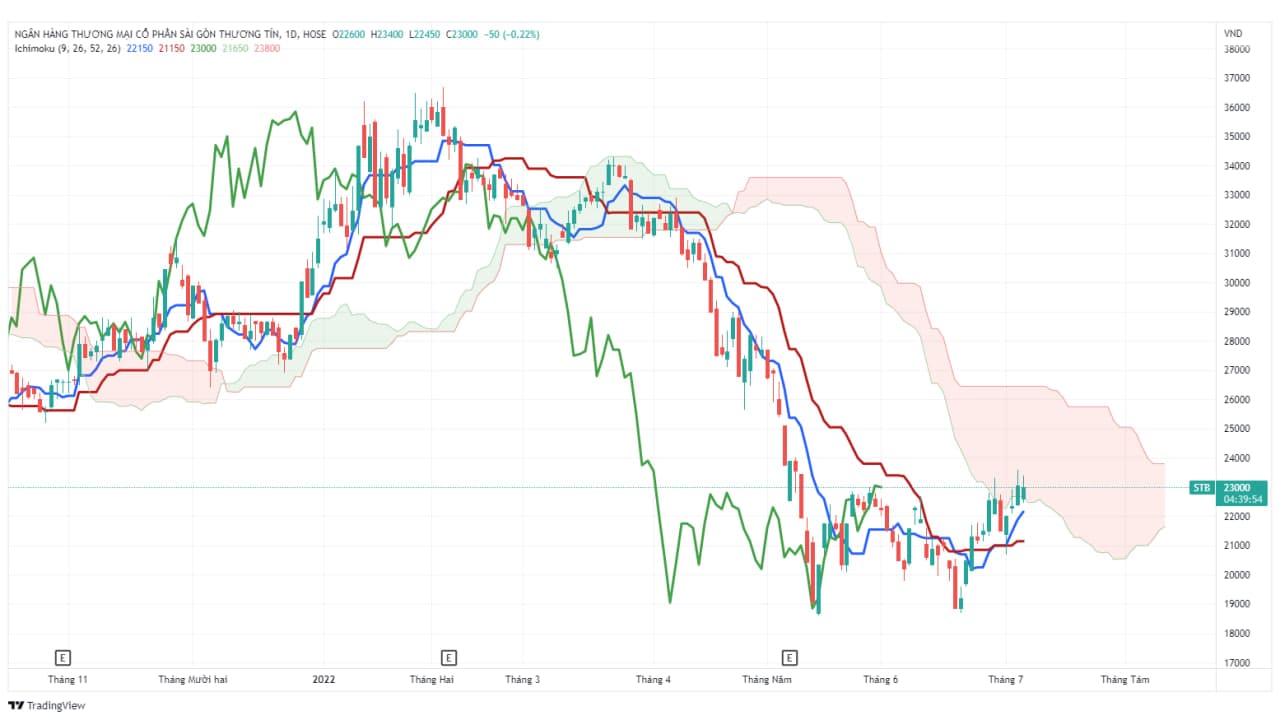
3.6. Ichimoku Cloud
The Ichimoku Cloud provides insights into market trends, support, resistance levels, and potential trading signals. It consists of five lines, including some similar to moving averages. In a bearish market, prices falling below the cloud can indicate selling opportunities.
3.7. Fibonacci Retracement
Fibonacci Retracement is used to identify potential support and resistance levels based on the Fibonacci sequence. It helps traders find reversal points during bearish trends by applying Fibonacci ratios (23.6%, 38.2%, 50%, 61.8%, and 78.6%) to the price range.
3.8. Trading Volume
Volume is a crucial indicator for assessing the strength of market trends. In a bearish market, rising volume during a downtrend can signal strong selling pressure, confirming the downward trend.
3.9. On-Balance Volume (OBV)
OBV measures buying and selling pressure based on volume. It can be especially helpful in confirming bearish trends or spotting potential trend reversals. In a bearish market, observe OBV moving in the same direction as the price to confirm the trend.
3.10. Average Directional Index (ADX)
ADX measures the strength of market trends, helping traders identify strong bearish trends and potential trading opportunities. An ADX value above 25 indicates a strong trend, while a value below 20 suggests a weak trend.
4. Trading Strategies in a Bearish Market
Diversifying the Portfolio:
Whether the market is declining or rising, each asset class has different levels of volatility. Diversifying your portfolio allows you to select the most promising coins/tokens within each category, helping to minimize the impact of price fluctuations in a specific area. If one part of the portfolio doesn't perform well, other asset types can help preserve the overall value of the portfolio.
Short Selling:
Short selling is a strategy that capitalizes on declining prices, where an investor opens a sell order in anticipation of a price drop, then buys back at a lower price to lock in profits. However, short selling carries high risks and requires careful risk management.
Safe-Haven Assets:
Consider shifting investments to safe-haven assets such as gold, the US dollar, or other assets that tend to preserve value during uncertain times.
Stop Loss and Take Profit Orders:
Use stop-loss orders to minimize risks when prices fall. Conversely, take-profit orders can be employed to secure profits when prices reach a predetermined target.
Limiting Trades and Reducing Leverage:
Limit the number of trades and reduce leverage to minimize risks. A bearish market can increase risk, and high leverage can heighten the potential for loss.
Finding New Investment Opportunities:
Sometimes, a bearish market creates new investment opportunities. Assets may be undervalued, presenting attractive buying conditions.
Remember, no strategy is perfect for every situation. Risk management and a thorough understanding of the market are crucial when trading in a bearish environment.
5. Conclusion
In a bearish market, despite declining prices, various opportunities for price appreciation arise. Diversifying the portfolio, employing short selling strategies, and maintaining a portfolio of safe assets can be intelligent ways to navigate challenging times. Assessing investment weights, staying informed about news, and being flexible in investment decisions are key for investors to confidently face a bearish market and capitalize on potential price increases.
Read more:


.jpg)