1. What is Fibonacci?

Fibonacci Originates from a Mathematical Concept
Fibonacci is not just a mathematical concept but also one of the most crucial tools in technical analysis and financial trading. Named after the renowned Italian mathematician Leonardo Fibonacci, the Fibonacci sequence is an infinite series of numbers that starts with 0 and 1, with each subsequent number being the sum of the two preceding ones. The Fibonacci sequence begins as follows: 0, 1, 1, 2, 3, 5, 8, 13, 21, 34, 55, 89, and continues onward.
Fibonacci's discovery is not merely a mathematical find. In practice, the Fibonacci sequence and its related percentages (including 23.6%, 38.2%, 50%, 61.8%, and 78.6%) are widely used in technical analysis to predict and measure support and resistance levels in financial markets.
2. Significance of Fibonacci

The Fibonacci sequence and related percentages (such as 23.6%, 38.2%, 50%, 61.8%, and 78.6%) hold significant importance in technical analysis and financial trading. Here’s a detailed look at their significance:
Identifying Support and Resistance Levels
Fibonacci percentages are commonly used to identify important support and resistance levels in the market. When the price of a stock or asset approaches these Fibonacci levels, they can become critical points for placing buy or sell orders or for assessing risk and potential profit.
Market Reaction
Fibonacci levels often create price points where the market may react. For example, if a cryptocurrency falls to the 38.2% Fibonacci retracement level and then starts to rise again, it might indicate that the downtrend has ended and a new uptrend could begin.
Predicting Potential Price Levels
Fibonacci extension levels are used to predict potential price levels that the price might reach after forming a new high or low. Traders often use these levels to set profit targets or identify potential exit points for a trade.
Support in Trading Decisions
Fibonacci provides not only significant support and resistance levels but also helps traders determine entry and exit points in a more controlled manner. By using Fibonacci retracement and extension, traders can pinpoint crucial price levels for buying and selling, as well as manage risk and potential returns.
3. Main Fibonacci Technical Analysis Tools
Fibonacci is used in three main ways in technical analysis:
Fibonacci Retracement
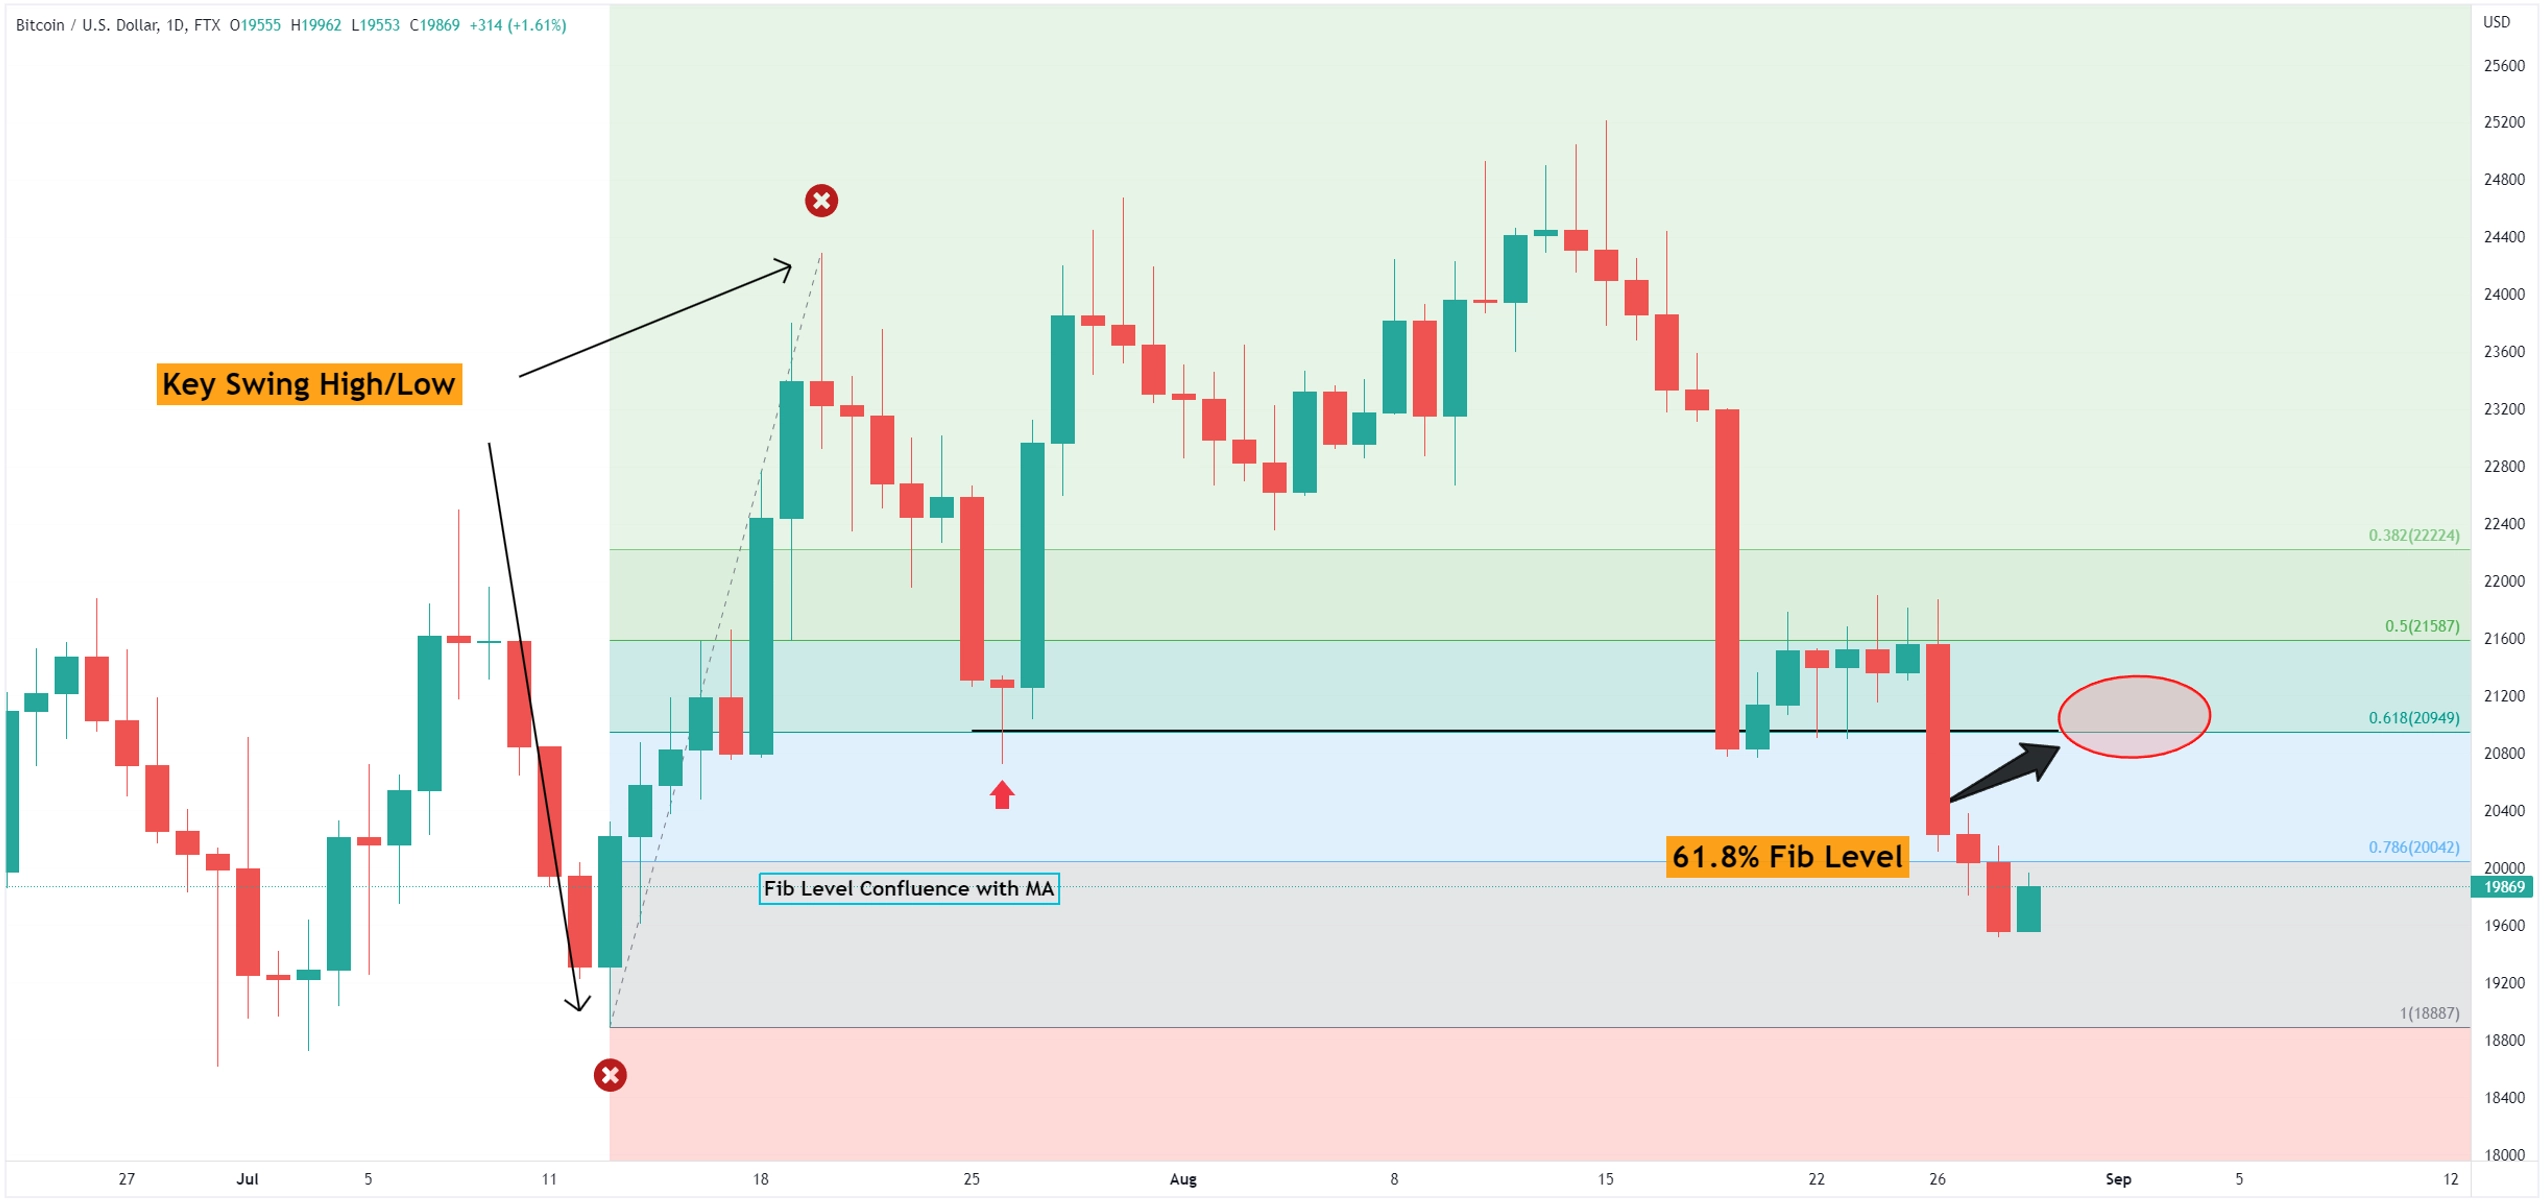
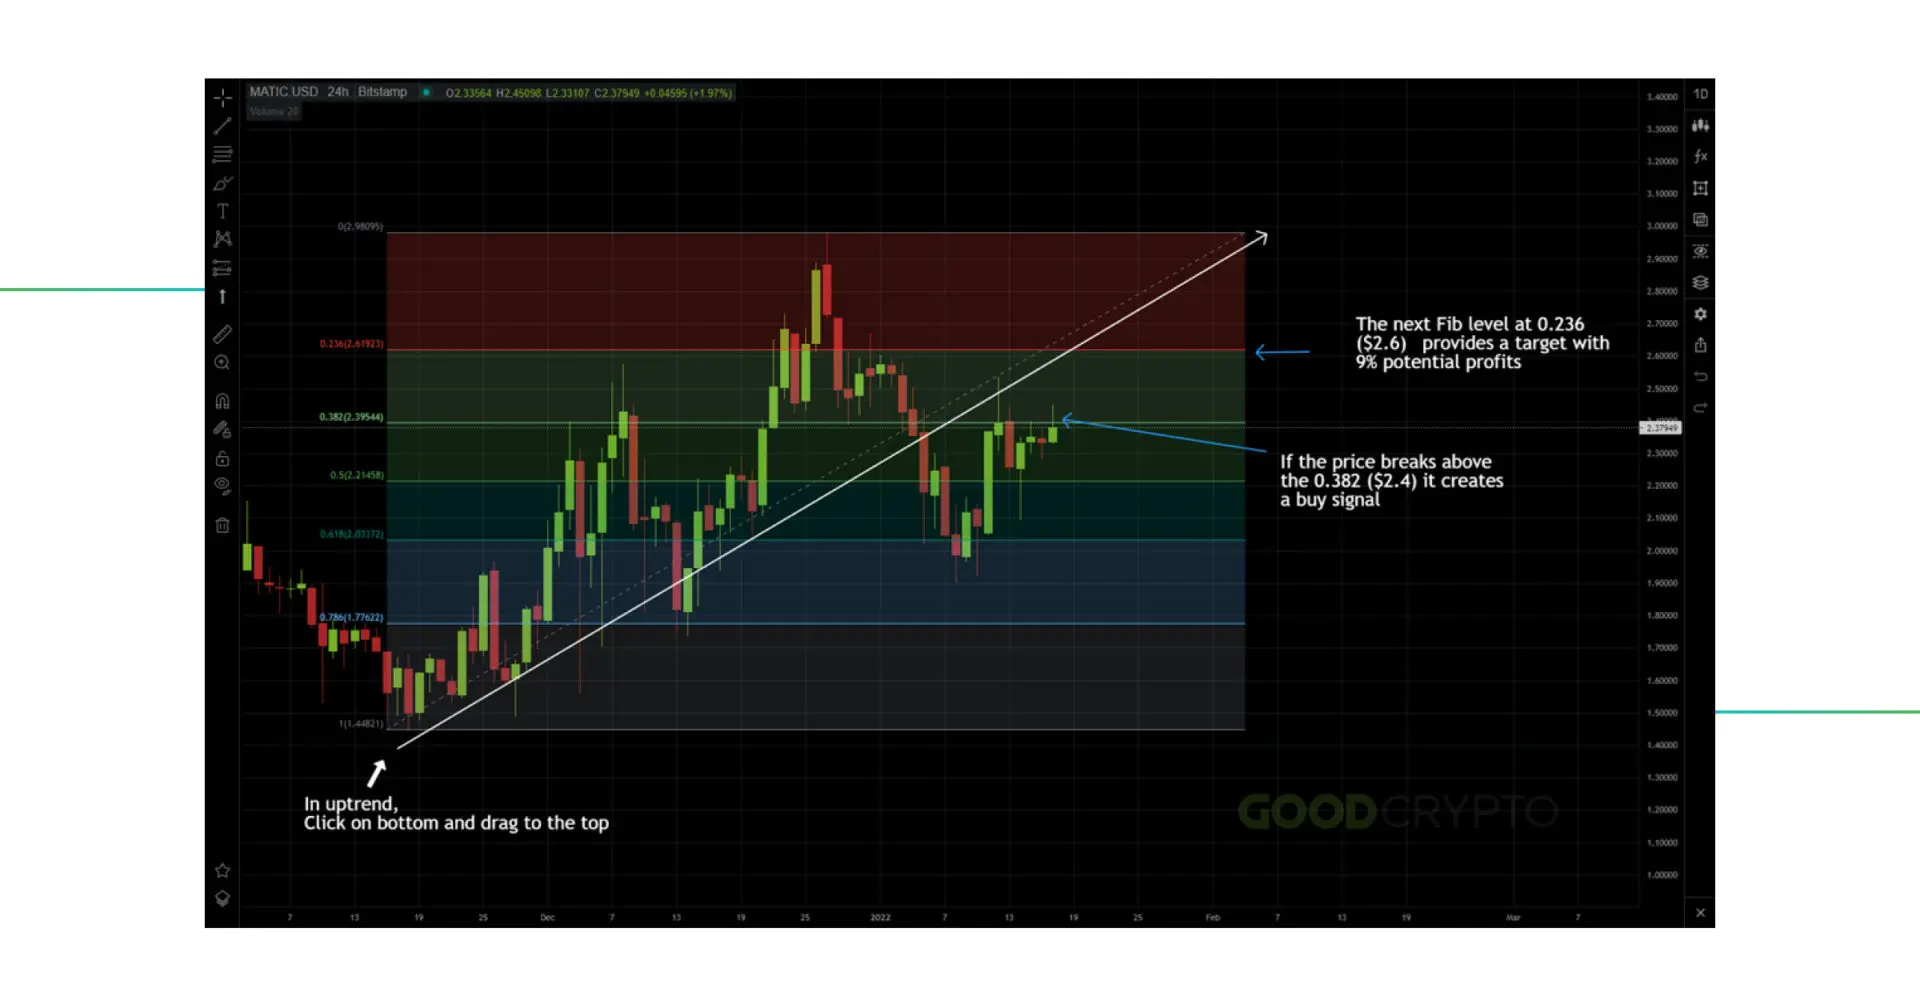
Fibonacci retracement is a technical analysis tool used to measure the extent of a price trend's retracement. Fibonacci percentages, such as 23.6%, 38.2%, 50%, 61.8%, and 78.6%, are commonly employed to identify potential support and resistance zones in the market.
Fibonacci Extension
Fibonacci extension is used to identify potential price levels that the price may reach after creating a new high or low. Important extension percentages include 127.2%, 161.8%, and 261.8%, which are used to set potential levels for subsequent trends.
Fibonacci Fan
The Fibonacci fan is another tool used to identify support and resistance levels in the market. It is based on the degree of trend growth and creates trendlines based on Fibonacci percentages.
4. Using Fibonacci to find profit taking points

Applying Fibonacci to Find Profit Taking Points
Using Fibonacci to identify profit-taking points is a popular method in financial trading. Here are several ways to apply Fibonacci in determining profit-taking points:
Fibonacci Retracement
When an uptrend is identified, traders can use Fibonacci retracement to measure the extent of the trend’s correction.
Fibonacci percentages like 38.2%, 50%, and 61.8% are often used as potential support levels in an uptrend.
When the price touches one of these percentages, it may signal that the uptrend could continue, and traders might choose a profit-taking point at a desired profit level.
Fibonacci Extension
When an uptrend or downtrend is established, traders can use Fibonacci extension to predict potential price levels the price might reach after the trend has formed a new high or low.
Extension percentages such as 127.2%, 161.8%, and 261.8% are commonly used to identify potential price levels for the next trend.
When the price reaches one of these extension levels, it might be a potential profit-taking point for traders.
Combining Retracement and Extension
A common approach to finding profit-taking points is to combine both Fibonacci retracement and extension tools.
Traders can use retracement to identify support and resistance levels within a trend and then use extension to predict potential price levels for the next trend.
When the price reaches a significant support or resistance level, combined with an extension level, it could be an ideal profit-taking point for traders.
Remember, Fibonacci is not a tool for making precise predictions 100% of the time, and using it requires skill and understanding. Additionally, always combine Fibonacci with other factors such as risk management to ensure effective trading.
5. Conclusion
Using Fibonacci in financial trading is a powerful tool that helps traders predict market trends and find effective entry and exit points. The Fibonacci sequence and its percentages not only provide crucial support and resistance levels but also assist in predicting potential price levels and market reactions.
However, using Fibonacci should be combined with other factors such as risk management and an understanding of market conditions. Moreover, Fibonacci is not a tool for making precise predictions 100% of the time, and its use requires skill and experience from the trader's side.
Read More:
- What is Crypto Slang? Essential terms every trader should know
- What is Birdeye? How to become a better crypto trader with Birdeye
- What is Copy Trade? Top 3 popular copy trade platforms

 English
 Tiếng Việt
.jpg)

.jpg)
.jpg)
.jpg)

.jpg)
.jpg)

.jpg)
.jpg)
.jpg)


