English
 Tiếng Việt
1. What is a Reversal Candle Pattern?
A reversal candle pattern is a configuration of Japanese candlesticks that signifies the potential conclusion of an ongoing trend, indicating a shift in favor of an opposing one. These patterns, whether bullish or bearish, are formed by one or more candles and serve as indicators for potential changes in asset prices.
Numerous candlestick reversal patterns exist, each carrying varying degrees of strength and reliability. Among the widely recognized ones are the bullish engulfing pattern, bearish engulfing pattern, bullish harami pattern, and bearish harami pattern. Traders often leverage these patterns to pinpoint potential reversals in the market, helping them make more informed decisions about buying or selling assets.
2. Why are Reversal Candle Patterns important?
Reversal candle patterns are important in technical analysis as they provide potential signals of a change in the direction of price movement in financial markets. Traders and analysts use these patterns to identify potential trend reversals and make informed decisions about buying or selling assets. Here are some reasons why reversal candle patterns are considered important:
Signal Potential Trend Reversals: Reversal candle patterns suggest a possible shift in market sentiment. For example, a bullish reversal pattern may indicate that a downtrend is losing momentum and a potential reversal to an uptrend is imminent, and vice versa for bearish reversal patterns.
Confirmation of Support or Resistance Levels: Reversal patterns often occur at key support or resistance levels. When a reversal pattern forms near a significant level, it can provide additional confirmation that the level is strong and may result in a reversal of the current trend.
Entry and Exit Points: Traders use reversal patterns to identify potential entry and exit points for their trades. If a reversal pattern suggests a change in trend direction, traders may enter a new position or exit an existing one, depending on the nature of the pattern.
Risk Management: Reversal patterns can also be used for risk management. For example, a trader might place a stop-loss order below a bullish reversal pattern or above a bearish reversal pattern to limit potential losses if the anticipated reversal does not occur.
Psychological Insight: Reversal candle patterns often reflect shifts in market psychology. For instance, a doji or hammer pattern may indicate indecision or a potential reversal of sentiment, providing insights into the battle between bulls and bears in the market.
Confirmation with Other Indicators: Traders often use reversal candle patterns in conjunction with other technical indicators, such as moving averages, RSI (Relative Strength Index), or MACD (Moving Average Convergence Divergence), to strengthen their analysis and increase the probability of accurate predictions.
Patterns Serve as Trading Signals: Some traders employ reversal candle patterns as standalone signals for making trading decisions. When a specific pattern is identified, it serves as a signal to take action, either entering a trade or adjusting existing positions.
It's important to note that while reversal candle patterns can be valuable tools in technical analysis, no single indicator or pattern is foolproof. Traders often use a combination of tools and analysis techniques to make well-informed decisions in the dynamic and complex financial markets.
3. Bullish vs. Bearish Reversal Candles: Differences
Bullish and bearish reversal candles are distinct patterns in Japanese candlestick charting that signal potential shifts in market sentiment. Here are the key differences between bullish and bearish reversal candles:
| Bullish Reversal Candles | Bearish Reversal Candles | |
| Direction of Trend | These patterns form during a downtrend and suggest a potential reversal to an uptrend. They indicate that buyers are gaining control, and there might be a shift from selling to buying pressure. | Forming during an uptrend, bearish reversal candles indicate a potential change to a downtrend. They signal that sellers are gaining strength, and there could be a shift from buying to selling pressure. |
| Candlestick Shapes | Common bullish reversal patterns include the hammer, engulfing pattern, or morning star. These patterns often have long lower shadows or bodies, signaling a rejection of lower prices and potential upward momentum. | Bearish reversal patterns may include the shooting star, engulfing pattern, or evening star. These patterns typically have long upper shadows or bodies, suggesting rejection of higher prices and potential downward momentum. |
| Market Psychology | These patterns reflect a change in sentiment from bearishness to bullishness. They indicate that after a period of selling pressure, buyers are stepping in, creating potential opportunities for an upward price movement. | Bearish reversal patterns signify a shift in sentiment from bullish to bearish. They suggest that after a period of buying pressure, sellers are gaining control, opening up possibilities for a downward price movement. |
| Confirmation and Context | Traders often look for confirmation from other technical indicators or patterns to increase the reliability of a bullish reversal signal. Additionally, the context of where the pattern forms in relation to support levels can add significance. | Similar to bullish reversals, confirmation from other indicators and consideration of the context, such as proximity to resistance levels, can enhance the reliability of a bearish reversal signal. |
| Examples | Hammer, Bullish Engulfing, Morning Star. | Shooting Star, Bearish Engulfing, Evening Star. |
Understanding these differences is crucial for traders and analysts who use candlestick patterns to make informed decisions in financial markets, as it helps them recognize and interpret potential trend reversals accurately.
4. Top Bullish Reversal Candlestick Patterns
4.1. Three White Soldiers
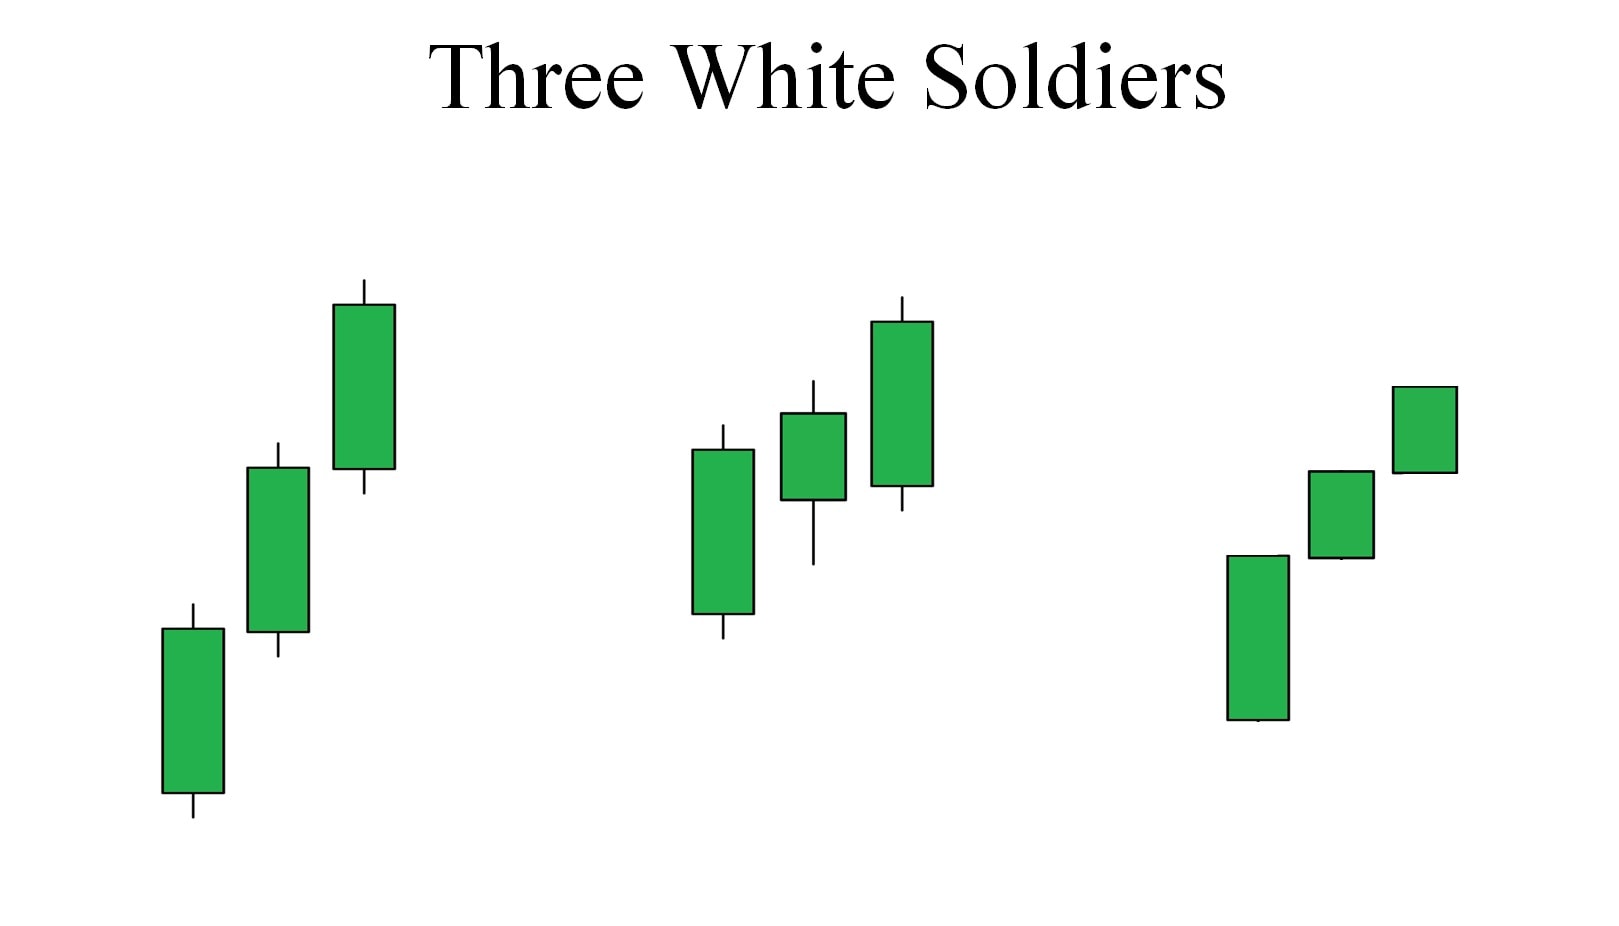
The "Three White Soldiers" pattern comprises three consecutive long-bodied candlesticks. These candles open within the previous candle's body and conclude their respective sessions above the previous candle's high. Notably, the wicks or shadows of these candles are relatively small, indicating a sustained market rally with minimal setbacks throughout each candle's duration.
In simple terms, the pattern signifies a takeover by bullish forces, consistently closing near the high of each candle over a three-session period. The strength of this signal can be further enhanced if there is an increase in trading volume accompanying the formation of the Three White Soldiers pattern.
4.2. Dragonfly Doji
The dragonfly doji is a distinctive form of the doji pattern characterized by having identical high, open, and close prices. In this pattern, there is no actual body, but it features a prominent and elongated lower tail or shadow. Resembling the shape of a dragonfly, this pattern is readily identifiable on charts.
This pattern serves as a robust bullish signal. The presence of a dragonfly doji implies that after a period of lower trading, the market experiences a rapid rebound, ultimately closing at the same price as the open.
4.3. Morning Star
The morning star pattern consists of three candlesticks. Initially, a sizable bearish candle marks the first phase. Subsequently, the second candle extends to a new low but rebounds slightly, resulting in a small body. The third and final candle is notably bullish, retracing a significant portion of the entire pattern and closing beyond the midpoint of the first candle.
The name "morning star" is derived from the symbolism of the second candle, representing the emergence of the sun from below the horizon during the early morning hours.
4.4. Three-Line Strike
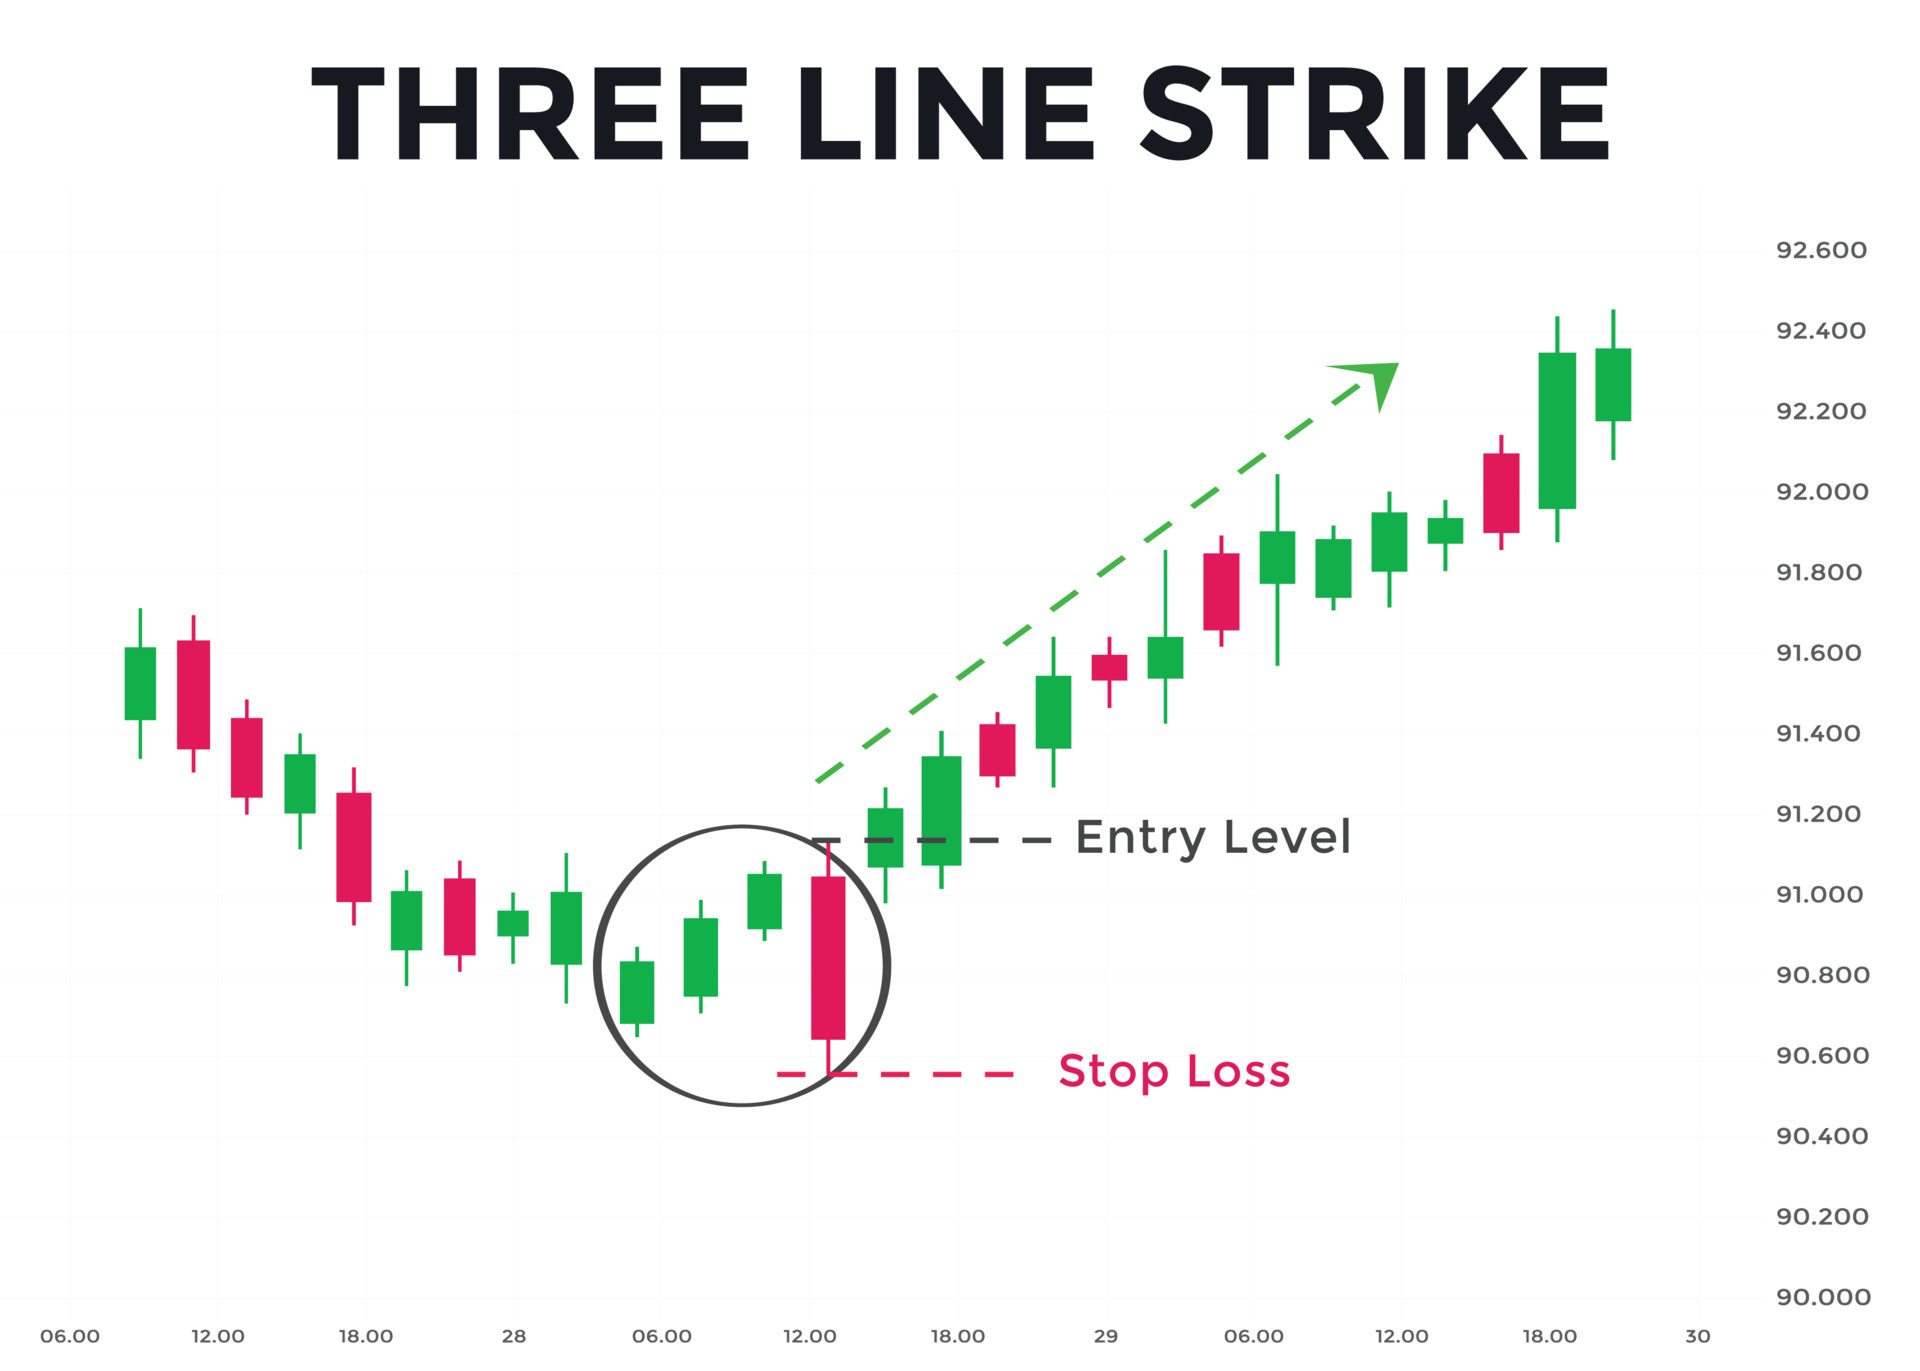
The three-line strike is a pattern comprising four candlesticks. The initial three candles are bullish, demonstrating a progressive increase in closing prices. The final candle, however, is bearish and concludes below the opening level of the first candle.
This formation proves effective in upward-trending markets. The downward correction observed in the last candle presents traders with a potential entry point during a dip, offering an opportunity to capitalize on the price retracement.
4.5. Morning Doji Star
The morning doji star pattern comprises three candles. The key distinction lies in the fact that in the morning doji star, the second candle forms a doji.
4.6. Bullish Engulfing
The bullish engulfing pattern is a formation involving two candlesticks, initiated by a bearish first candle. The second candle extends to a new low but ultimately closes above the opening of the initial candle. Notably, the second candle engulfs the entire body of the first one, hence the name of the pattern.
This robust formation is compelling as it signifies a brief dip to a new low in the market, followed by a strong rally that surpasses the opening level of the pattern.
4.7. Hammer Candlestick
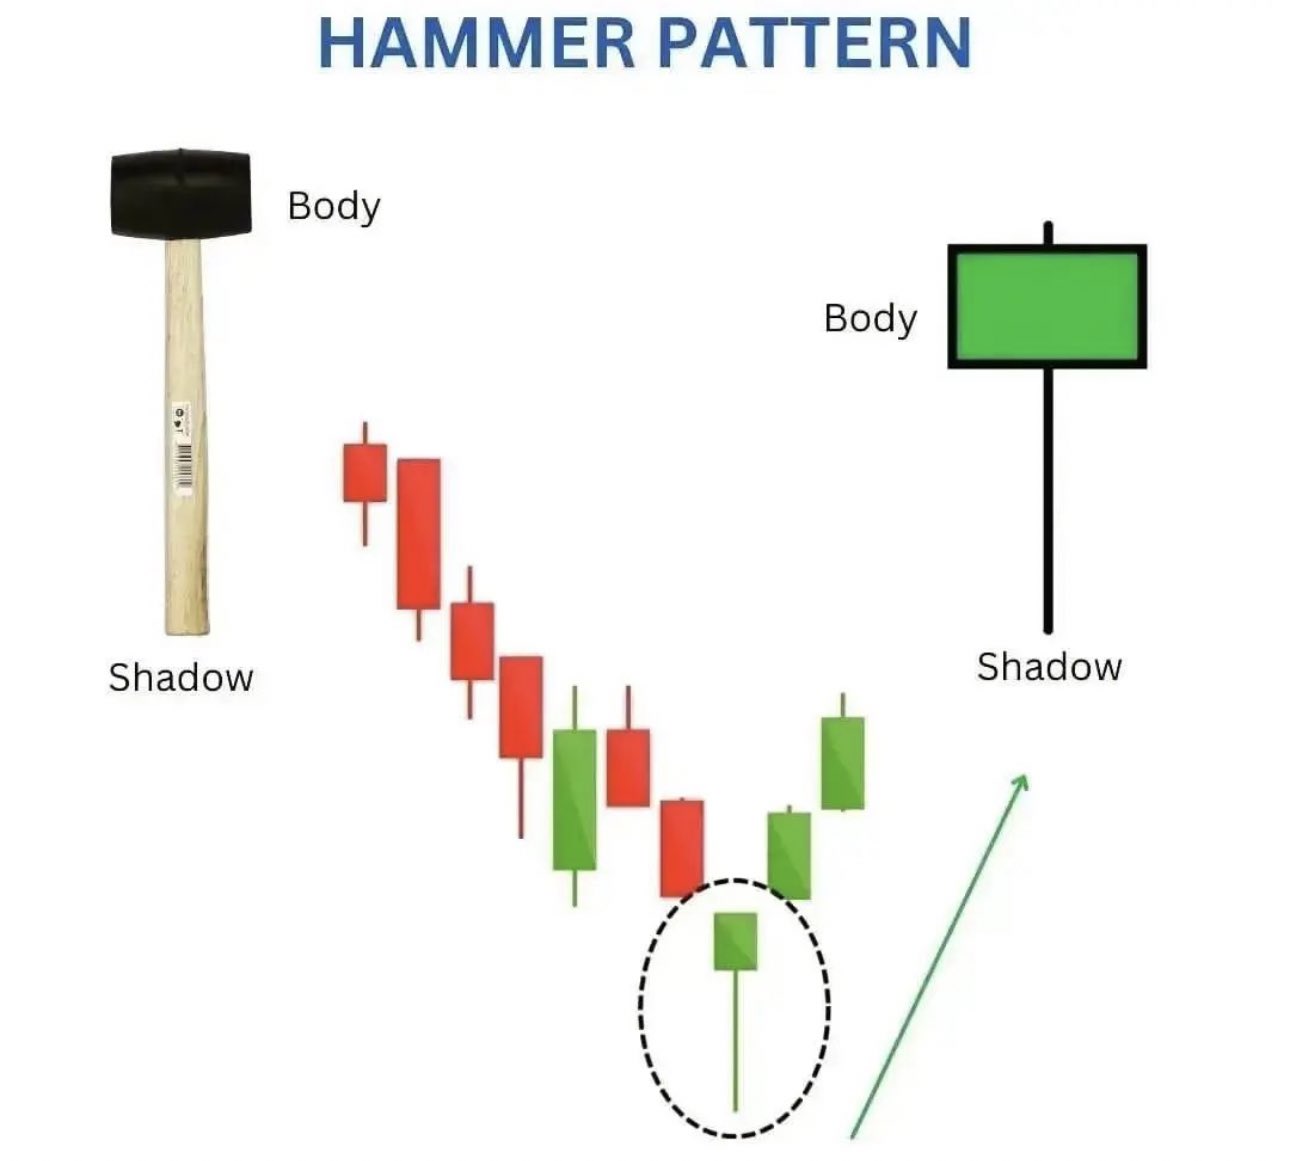
The hammer pattern is a straightforward single-candlestick formation, making it easily discernible on cryptocurrency charts. Marked by a relatively small body, the hammer is characterized by an extended tail or wick to the bottom.
The hammer can appear in either green or red, but its distinctive feature is the long wick pointing downward, suggesting the potential formation of a rally. This indicates that although the market briefly traded at lower levels, prices swiftly rebounded near the opening, signifying bullish momentum.
4.8. Bullish Harami
The bullish harami is a two-candlestick pattern characterized by a large initial bearish candle followed by a smaller green candle. What distinguishes this formation is that despite the initial bearish move, the second candle exhibits an upward movement with a relatively small body.
While this pattern may initially appear as a consolidation, it actually signifies a shift in sentiment within the trend—from a significant downward movement to a potential upward shift.
5. Top Bearish Reversal Candles
5.1. Shooting Star Candlestick
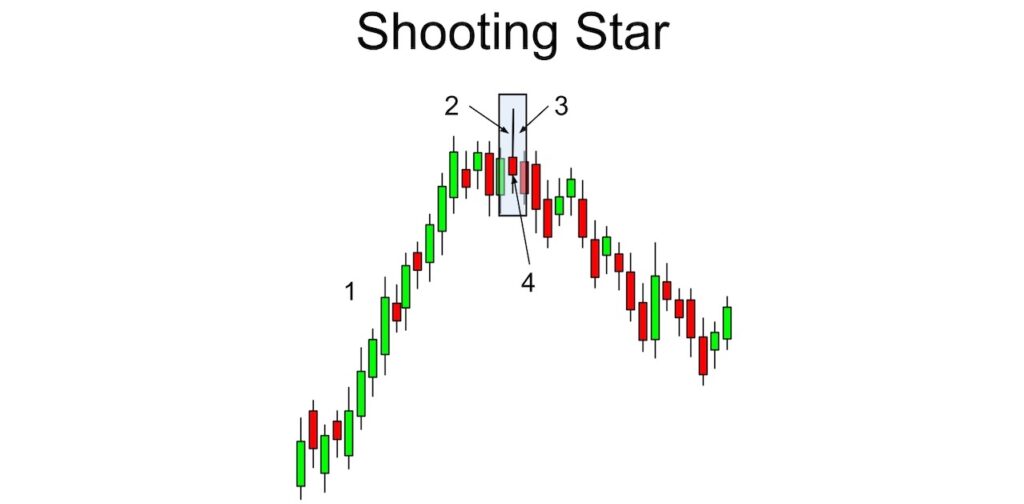
The shooting star is a solitary candlestick pattern signaling the conclusion of an uptrend. Manifesting as a candle with a diminutive body and an elongated wick extending upwards, this formation reflects a particular price movement.
This pattern emerges when prices surge to new highs right at the opening of the candle, only to reverse swiftly and return to proximity of the opening level. The prolonged upper wick indicates a robust presence of sellers in the market as it ascends, though this dominance is short-lived.
5.2. Hanging Man Candlestick
The hanging man is a lone candlestick pattern characterized by a diminutive body positioned at the top and an extensive wick extending downwards. The color of the candle's body may be either red or green.
Resembling a hammer in terms of its opening and closing prices remaining in proximity with a prolonged downside wick, the hanging man's distinctive feature lies in its context. Specifically, when this pattern emerges at the conclusion of an uptrend, it is regarded as a bearish signal, implying the potential onset of lower prices.
5.3. Evening Star
The evening star is a three-candle pattern indicating a potential significant correction. The initial candle is bullish, characterized by an average or larger-sized body. The second candle extends the rally but encounters a slowdown, resulting in a relatively small-bodied pattern. The third candle retraces toward the opening level of the first candle.
Due to its reliance on three candles for formation, this pattern is considered more conservative, as it necessitates a broader dataset to complete the setup. Its bullish counterpart is known as the morning star.
5.4. Bearish Engulfing
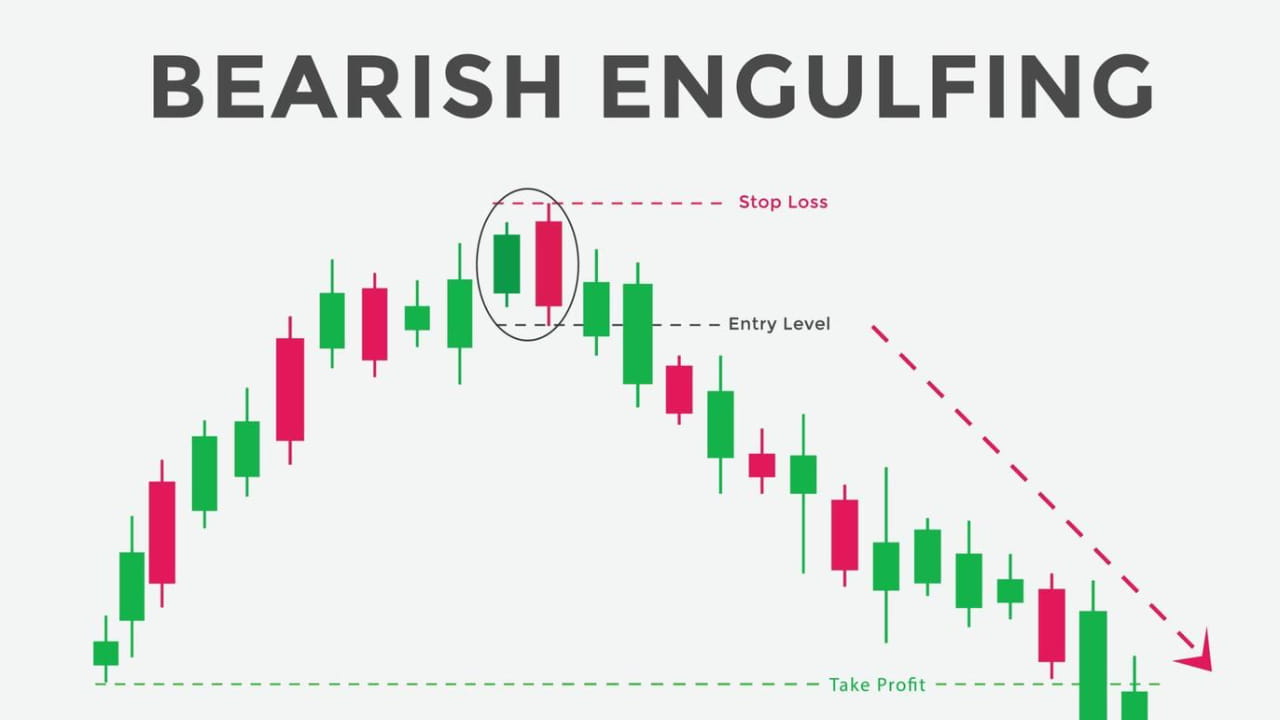
The bearish engulfing candlestick pattern comprises two candles. The initial candle is a robust bullish one within an ongoing uptrend. The following candle continues the upward momentum, reaching a new high before reversing and closing below the opening level of the first candle.
This reversal results in the second candle's body completely engulfing the body of the first candle, thus giving the pattern its name. It is a prevalent formation that offers a substantial indication of a potential shift towards a bearish reversal.
5.5. Evening Doji Star
The evening doji star is a distinctive variation of the evening star pattern. What sets this version apart is the presence of a doji in the second of the three candles, symbolizing indecision following an extended uptrend. This hesitancy indicates a potential waning of the rally's momentum.
The pattern reaches completion as the third candle retraces back to the opening level of the first candle, implying the likelihood of a more substantial correction taking place.
5.6. Three Black Crows
The three black crows is a bearish pattern characterized by a sequence of three descending candlesticks. Typically painted in black or red, these candles earn the pattern its name due to their consecutive appearance on the chart.
Each of the three candles in this formation exhibits minimal wicks or tails, indicating that prices opened near the high and closed near the low. This pattern commonly serves as a potent initiation of a more substantial correction in the market.
6. What to Do When Reversal Candle Formations Appear
Upon identifying reversal candle formations, traders must promptly analyze potential shifts in market direction. Understanding patterns like bullish engulfing or shooting stars is pivotal. The key lies in comprehending these indicators and seamlessly incorporating them into your trading strategy, adeptly managing existing positions, and potentially capitalizing on emerging market trends.
.png)
Entry Points:
Recognizing entry points entails identifying single, dual, or three-candlestick patterns. Traders are advised to enter a position aligning with the reversal's direction at the commencement of the subsequent candle. This approach allows for leveraging potential trend changes without waiting for additional confirmation.
Stop Loss:
Implementing a stop loss serves as a fundamental risk management tool. For bullish reversals, position the stop loss below the pattern's low; for bearish reversals, position it above the pattern's high. This strategy serves to shield against market movements counter to the anticipated trend.
Take Profit:
Establishing a take profit level involves ensuring it is at least twice the distance from the entry point to the stop loss. This ratio ensures a favorable risk-reward balance, aligning with your risk management strategy. It aims to maximize potential gains while minimizing potential losses, enhancing the overall effectiveness of your trading approach.
7. Common Mistakes to Avoid in Interpreting Candlestick Patterns

Effectively interpreting candlestick patterns is crucial for successful trading, and traders should be cautious of common mistakes.
One prevalent error is analyzing candlestick patterns in isolation, neglecting the broader market context. For example, while a Doji candle might suggest market indecision, its true significance becomes apparent when considered in the context of the prevailing trend and neighboring candlestick formations.
Another mistake involves underestimating the significance of volume in confirming candlestick patterns. Robust trading volume can enhance the reliability of a pattern, whether it signifies a continuation or potential reversal, indicating a more substantial market commitment.
Taking a comprehensive approach that considers the overall market environment minimizes the risk of misinterpretation, enabling traders to make more precise and dependable decisions.
3. What Is the 3 Candle Reversal Strategy?
The 3 candle reversal strategy is a technical analysis method employed in trading to detect potential reversals in market trends. This approach relies on observing and interpreting a specific sequence of three candlesticks on a price chart. The operational steps typically involve:
1 - Trend Identification:
Begin by identifying the existing trend in the market, whether it is bullish or bearish. The strategy is most effective when applied following a well-established and clear trend.
2 - Three Candle Pattern:
Look for a distinct pattern involving three candles:
-
First Candle: Aligns with the current trend, upward (green) for a bullish trend or downward (red) for a bearish trend.
-
Second Candle: Indicates the beginning of a reversal. In a bullish trend, it opens higher but closes below the midpoint of the first candle; in a bearish trend, it opens lower but closes above the midpoint of the first candle.
-
Third Candle: The pivotal candle confirming the reversal. In a bullish trend reversal, it should close well into the body of the first candle (preferably below it), and in a bearish trend reversal, it should close well above the body of the first candle.
3 - Confirmation and Entry:
Seek additional confirmation signals on the fourth candle or through technical indicators like volume, support and resistance levels, or momentum indicators. Entry points are often considered at the close of the third candle or the open of the fourth, depending on confirmation.
4 - Risk Management:
Implement crucial risk management practices by setting appropriate stop-loss orders and take-profit targets. This helps safeguard against potential losses and secure profits.
The 3 candle reversal strategy is favored for its simplicity and versatility across various time frames and markets. However, it is essential to recognize that no strategy guarantees success, and this approach should be used alongside other analytical tools and a comprehensive understanding of market conditions.
9. Conclusion
Reversal candlestick patterns stand out as invaluable tools in a trader's toolkit, offering the ability to identify potential market reversals and uncover profitable opportunities. As you venture further into the exciting yet challenging world of crypto trading, mastering the interpretation and application of these patterns can significantly enhance your ability to make informed decisions and navigate the ever-changing landscape of digital assets. Stay vigilant, stay informed, and leverage the power of reversal candlestick patterns to navigate the complexities of crypto trading with confidence.