English
 Tiếng Việt
1. What is a Liquidity Heatmap?
A Liquidity Heatmap is a graphical representation of liquidity levels across different price points in a market. It uses color-coded zones to indicate the concentration of buy and sell orders, open interest, or potential liquidation levels. Typically, the heatmap highlights areas where significant trading activity or leveraged positions are likely to occur, which can act as magnets for price action.
Key Components:
-
Color Gradient: Colors range from cool (e.g., blue or green) to warm (e.g., yellow or red). Cooler colors indicate lower liquidity or activity, while warmer colors signal higher liquidity or potential liquidation zones.
-
Price Levels: The vertical axis represents price ranges, showing where liquidity is concentrated.
-
Time Dimension: Some heatmaps include a horizontal axis to display liquidity changes over time, offering a historical perspective.
Liquidity Heatmaps are commonly used in platforms like TradingView, Bookmap, CoinGlass, and other trading software, each offering unique ways to visualize market data.
2. How to View a Liquidity Heatmap
Viewing a Liquidity Heatmap depends on the platform you're using, but the process generally involves the following steps:
Step 1: Choose a Trading Platform:
-
Select a platform that supports Liquidity Heatmaps, such as TradingView, Bookmap, CoinGlass, or TradingLite.
-
For example, CoinGlass is popular for cryptocurrency traders, while Bookmap is widely used for stocks and futures.
Step 2: Access the Heatmap Tool:
-
On TradingView, search for indicators like "Liquidity Heatmap" or "Open Liquidity Heatmap" by creators such as BigBeluga.
-
On Bookmap, the heatmap is a core feature, displaying real-time order book data.
-
On CoinGlass, navigate to the "Liquidation Heatmap" section for your chosen trading pair (e.g., BTC/USD).
Step 3: Customize Settings:
-
Timeframe: Select a timeframe (e.g., 12 hours, 24 hours, or 7 days) to analyze short-term or long-term liquidity patterns.
-
Leverage Levels: Adjust leverage settings (e.g., 5x, 10x, 20x) to see liquidation zones for different trading strategies.
-
Color Scheme: Choose a color gradient that suits your visual preference for better readability.
-
Lookback Period: Set the historical range (e.g., 500 candles) to calculate liquidity accumulation.
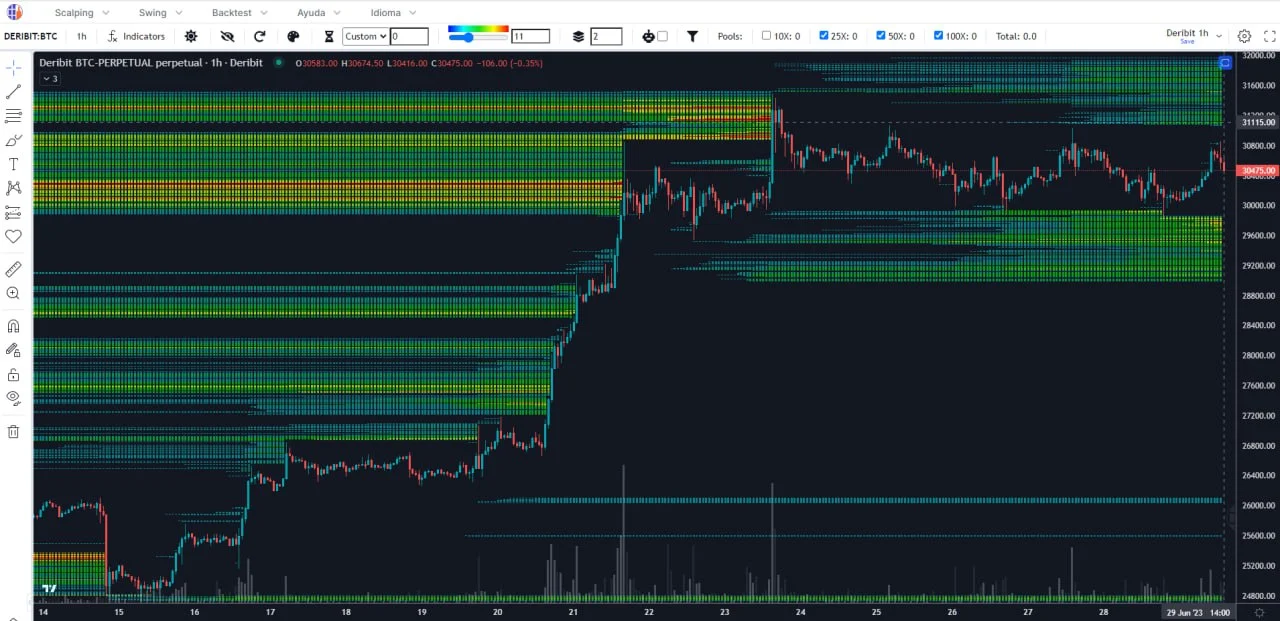
Step 4: Interpret the Display:
-
Observe the color intensity: Bright or warm colors (yellow/red) indicate high liquidity zones, often where stop-loss orders or liquidations cluster.
-
Note the price levels: High liquidity areas may act as support (buy orders) or resistance (sell orders).
-
Check for historical patterns: Some heatmaps show how liquidity has evolved, helping you spot recurring trends.
3. How to Use a Liquidity Heatmap in Trading
Once you can view the Liquidity Heatmap, the next step is leveraging it to enhance your trading strategy. Here are practical ways to use it:
Step 1: Identify Support and Resistance Zones
High liquidity zones often act as support or resistance because they represent areas with significant buy or sell orders. For example:
-
A bright yellow zone below the current price might indicate a cluster of buy orders, suggesting a potential support level.
-
A red zone above the price could signal sell orders or stop-losses, acting as resistance.
-
Application: Place trades near these zones, anticipating price bounces or reversals, but confirm with other indicators like moving averages or RSI to avoid false signals.
Step 2: Spot Potential Liquidation Levels
In leveraged markets like cryptocurrencies, Liquidity Heatmaps highlight where large-scale liquidations may occur. For instance:
-
A yellow zone on a CoinGlass heatmap might show a price level where many traders' positions could be liquidated, causing volatility.
-
Application: Avoid entering trades in high-liquidation zones during volatile periods, or use these levels to plan entries/exits. For example, if Bitcoin is approaching a $60,000 liquidation zone, expect a sharp move and prepare accordingly.
Step 3: Anticipate Price Magnets
Liquidity acts like a magnet, attracting price action to areas with high order concentration. Heatmaps help you predict where the price might move next.
-
Application: If a heatmap shows a dense liquidity zone slightly above the current price, consider a short-term bullish trade, expecting the price to test that level. Combine with candlestick patterns for confirmation.
Step 4: Improve Risk Management
By identifying high-risk zones, Liquidity Heatmaps help you set better stop-loss and take-profit levels.
-
Application: Place stop-losses outside high-liquidation zones to avoid being swept by sudden price swings. For instance, if a heatmap shows heavy liquidity at $50,000, set your stop-loss slightly below to account for potential volatility.
Step 5: Combine with Other Tools
A Liquidity Heatmap is most effective when used alongside other technical analysis tools:
-
Volume Profile: Compare liquidity zones with the Point of Control (POC) to confirm high-activity areas.
-
Order Book: Use real-time order book data to validate heatmap signals.
-
Indicators: Pair with RSI, MACD, or Bollinger Bands to filter out noise and improve trade accuracy.
-
Application: If a heatmap shows a high liquidity zone that aligns with a Fibonacci retracement level and an oversold RSI, it’s a stronger signal for a potential reversal.
4. Best Practices for Using Liquidity Heatmaps

To maximize the benefits of Liquidity Heatmaps, keep these tips in mind:
-
Understand Market Context: Heatmaps don’t guarantee price movements. Always consider news, economic events, and overall market sentiment.
-
Avoid Over-Reliance: Use heatmaps as part of a broader strategy, not as a standalone signal.
-
Regularly Update Settings: Markets are dynamic, so adjust heatmap parameters (e.g., timeframe, leverage) to reflect current conditions.
-
Practice on a Demo Account: Test your heatmap-based strategy in a risk-free environment before trading with real capital.
-
Choose Reliable Data Sources: Platforms like CoinGlass or Bookmap aggregate data from multiple exchanges, ensuring accuracy.
5. Common Mistakes to Avoid
-
Misinterpreting Colors: Assuming a bright zone is always support or resistance without checking order types (buy/sell).
-
Ignoring Timeframes: Using a short-term heatmap for long-term trades or vice versa.
-
Neglecting Confirmation: Entering trades based solely on heatmap data without validating with other indicators.
-
Overcomplicating Settings: Using too many levels or lookback periods, which can clutter the chart and obscure signals.
6. Conclusion
The Liquidity Heatmap is a versatile tool that offers traders a clear view of market liquidity, helping them anticipate price movements and manage risks effectively. By learning how to view and interpret the heatmap on platforms like TradingView, Bookmap, or CoinGlass, you can identify key price levels, spot liquidation risks, and refine your trading strategy. Remember to combine the heatmap with other technical tools, stay mindful of market context, and practice regularly to build confidence. With time and experience, the Liquidity Heatmap can become a cornerstone of your trading toolkit, guiding you toward smarter, more informed decisions.
Read more: