Tiếng Việt
1. What Is Crypto Analytics?
Before diving into tools or dashboards, let’s define the term.
Crypto analytics is the process of collecting, organizing, and interpreting blockchain and market data to understand cryptocurrency activity. It answers questions such as:
-
Who is buying or selling a token?
-
How healthy is a network?
-
Are transactions legitimate or suspicious?
-
Is the protocol growing or losing traction?
It combines several disciplines:
-
Blockchain analytics: examining and clustering wallet activity across public blockchains.
-
On chain data analytics: studying transaction patterns, wallet flows, and network behavior directly from blockchain records.
-
Market analytics: tracking price, liquidity, derivatives, and sentiment to complement on-chain insights.
Crypto analytics bridges raw blockchain data and real-world business or trading decisions.
2. How Crypto Analytics Works
Behind every clean dashboard or whale alert lies a complex data pipeline. Understanding how crypto analytics works helps you see where the insights come from, and what their limitations are.
- Data Collection & Indexing: Every blockchain records data on transactions, blocks, and smart contracts. However, reading raw blockchain data is complex and slow. That’s why modern platforms index the data, storing it in structured databases accessible through APIs or SQL-like tools.
- Address Labeling & Entity Mapping: Addresses are pseudonymous by default. Crypto analytics tools enrich data by identifying wallet owners, clustering related addresses, and labeling entities such as exchanges, protocols, and funds. This process allows analysts to distinguish “whales depositing ETH to Binance” from random transactions.
- Visualization & Insights: Finally, dashboards visualize data into metrics, graphs, and alerts. Users can monitor active addresses, exchange flows, or DeFi metrics in real time. This is the layer most traders and analysts interact with daily.
3. Key Metrics in On Chain Data Analytics
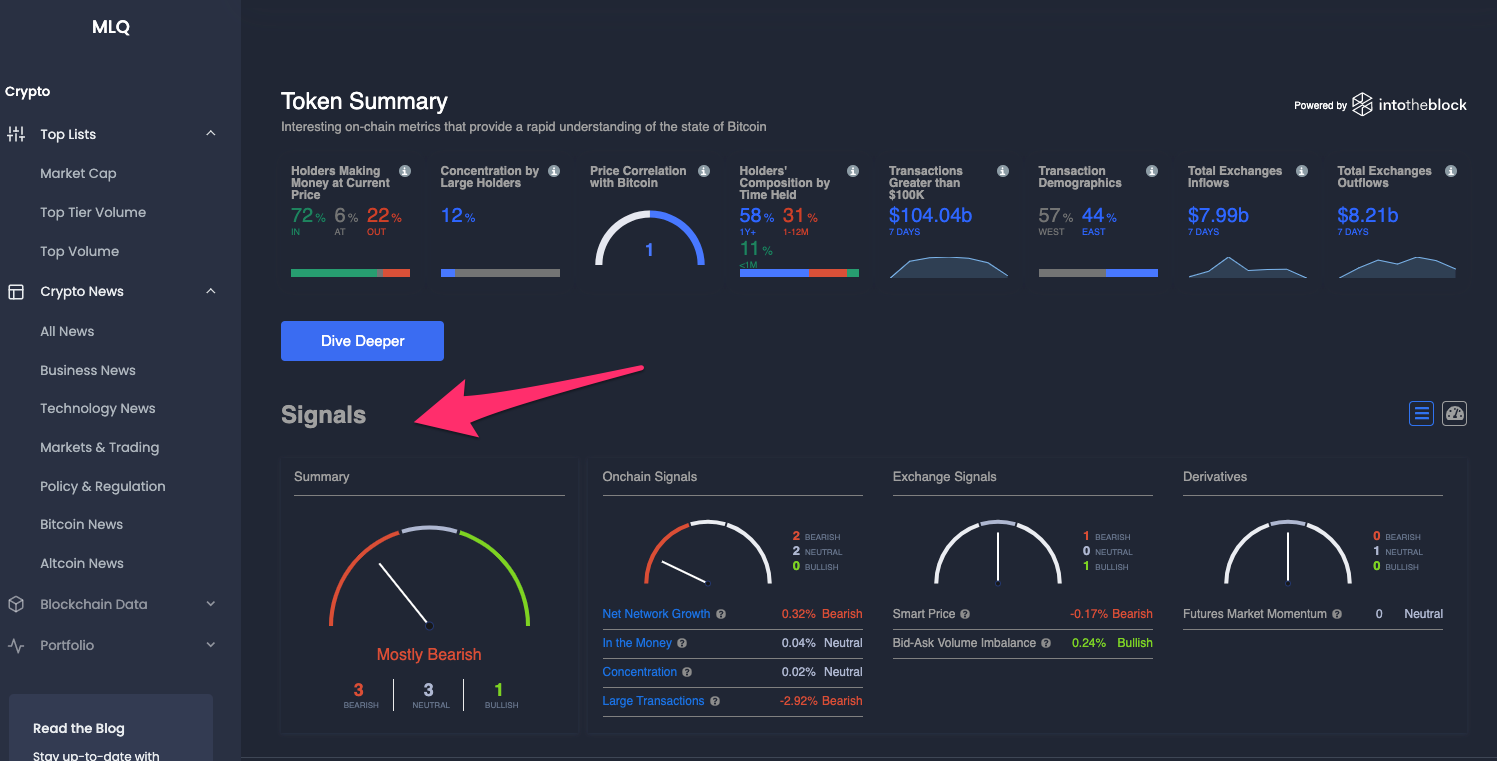
Understanding what metrics matter most is crucial for effective analysis.
3.1 Network Activity
-
Transaction count and value
-
Active and new addresses
-
Gas fees and network load
These reflect real blockchain usage beyond speculation.
3.2 Holder Concentration
-
Top wallet percentage
-
Distribution among small vs. large holders
-
Long-term vs. short-term ownership trends
Helps detect whale dominance and potential dump risks.
3.3 Exchange & Liquidity Flows
-
CEX inflows/outflows
-
DEX pool movements
-
Liquidity changes in major trading pairs
Critical for identifying accumulation or distribution phases.
3.4 Protocol Performance
-
Total Value Locked (TVL)
-
Protocol revenue and fees
-
User and transaction growth
These show whether a protocol’s ecosystem is thriving or stagnating.
3.5 Risk Metrics
-
Exposure to high-risk addresses
-
Mixer and darknet interactions
-
Entity risk scores
Important for compliance and institutional-grade monitoring.
4. Types of Blockchain Analytics Tools
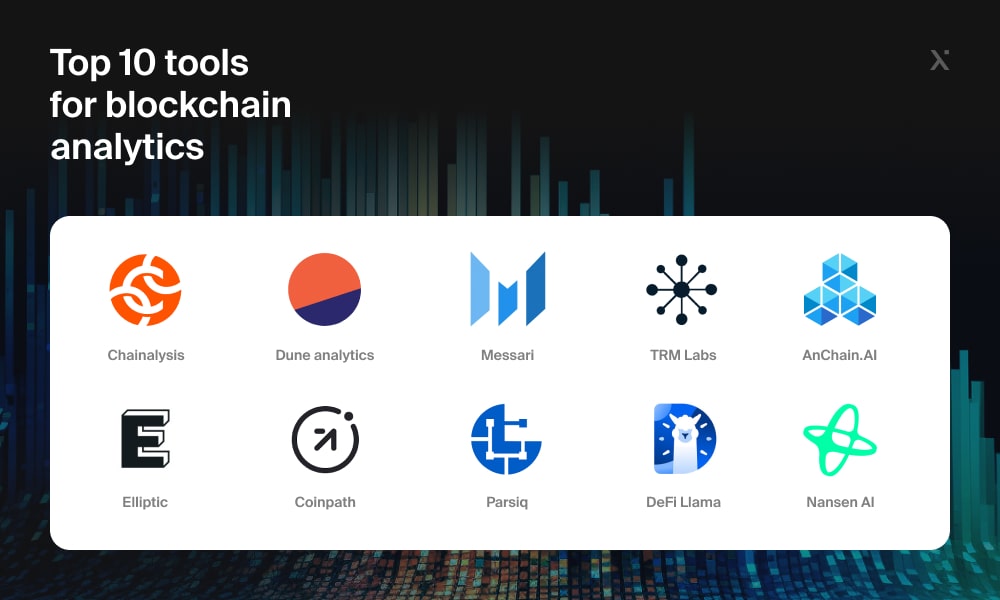
Not all crypto analytics platforms serve the same purpose. Depending on your goals: trading, compliance, research, or development, you’ll need different types of blockchain analytics tools. Below are the main categories and how they’re used.
4.1 Investor & Market Intelligence Platforms
For traders and investors, data speed and accuracy are everything. These platforms focus on real-time market insights powered by on-chain metrics and fundamental data.
Examples: Glassnode, Nansen, Santiment, Messari, Token Terminal, DeFiLlama.
They combine on-chain data (like wallet flows and active addresses) with DeFi statistics and token fundamentals, helping investors track sentiment shifts, liquidity trends, and market cycles.
4.2 Dashboard & No-Code Analytics
For analysts and researchers who don’t code, no-code analytics tools make blockchain data accessible through intuitive dashboards and visual builders.
Examples: Dune, Footprint Analytics, DappLooker.
These tools allow users to create custom dashboards, run SQL-like queries, or explore pre-built community reports. They’re ideal for visualizing DeFi activity, NFT trends, or cross-chain movements without needing deep technical skills.
4.3 Compliance & Investigation Tools
For institutions, exchanges, and regulators, transparency isn’t just a benefit—it’s a necessity. Compliance-focused blockchain analytics tools ensure that every transaction can be traced, audited, and verified.
These platforms specialize in risk scoring, AML (Anti-Money Laundering) compliance, and forensic investigation. Tools like Chainalysis, TRM Labs, Elliptic, and Merkle Science help identify suspicious flows, detect connections to sanctioned entities, and support law enforcement in tracking illicit funds.
4.4 Data Infrastructure Providers
Examples: Alchemy, Moralis, Google BigQuery blockchain datasets.
Ideal for developers building their own crypto analytics systems.
5. Limitations of Crypto Analytics
Despite its power, crypto analytics has some blind spots:
-
Privacy tools (mixers, private chains) obscure visibility.
-
Heuristic labeling may misclassify wallets.
-
Off-chain context (private deals, CEX data) isn’t visible.
-
Multi-chain fragmentation complicates unified analysis.
That’s why on chain analytics should complement, not replace, other research methods.
6. Conclusion
Crypto analytics turns transparency into strategy. Whether you’re a trader, project team, or researcher, mastering on chain data analysis gives you an edge in understanding how money and information truly move across blockchains.
Read more:


%20(21).png)
%20(19).png)
%20(18).png)
.png)