1. What are bullish patterns in crypto?
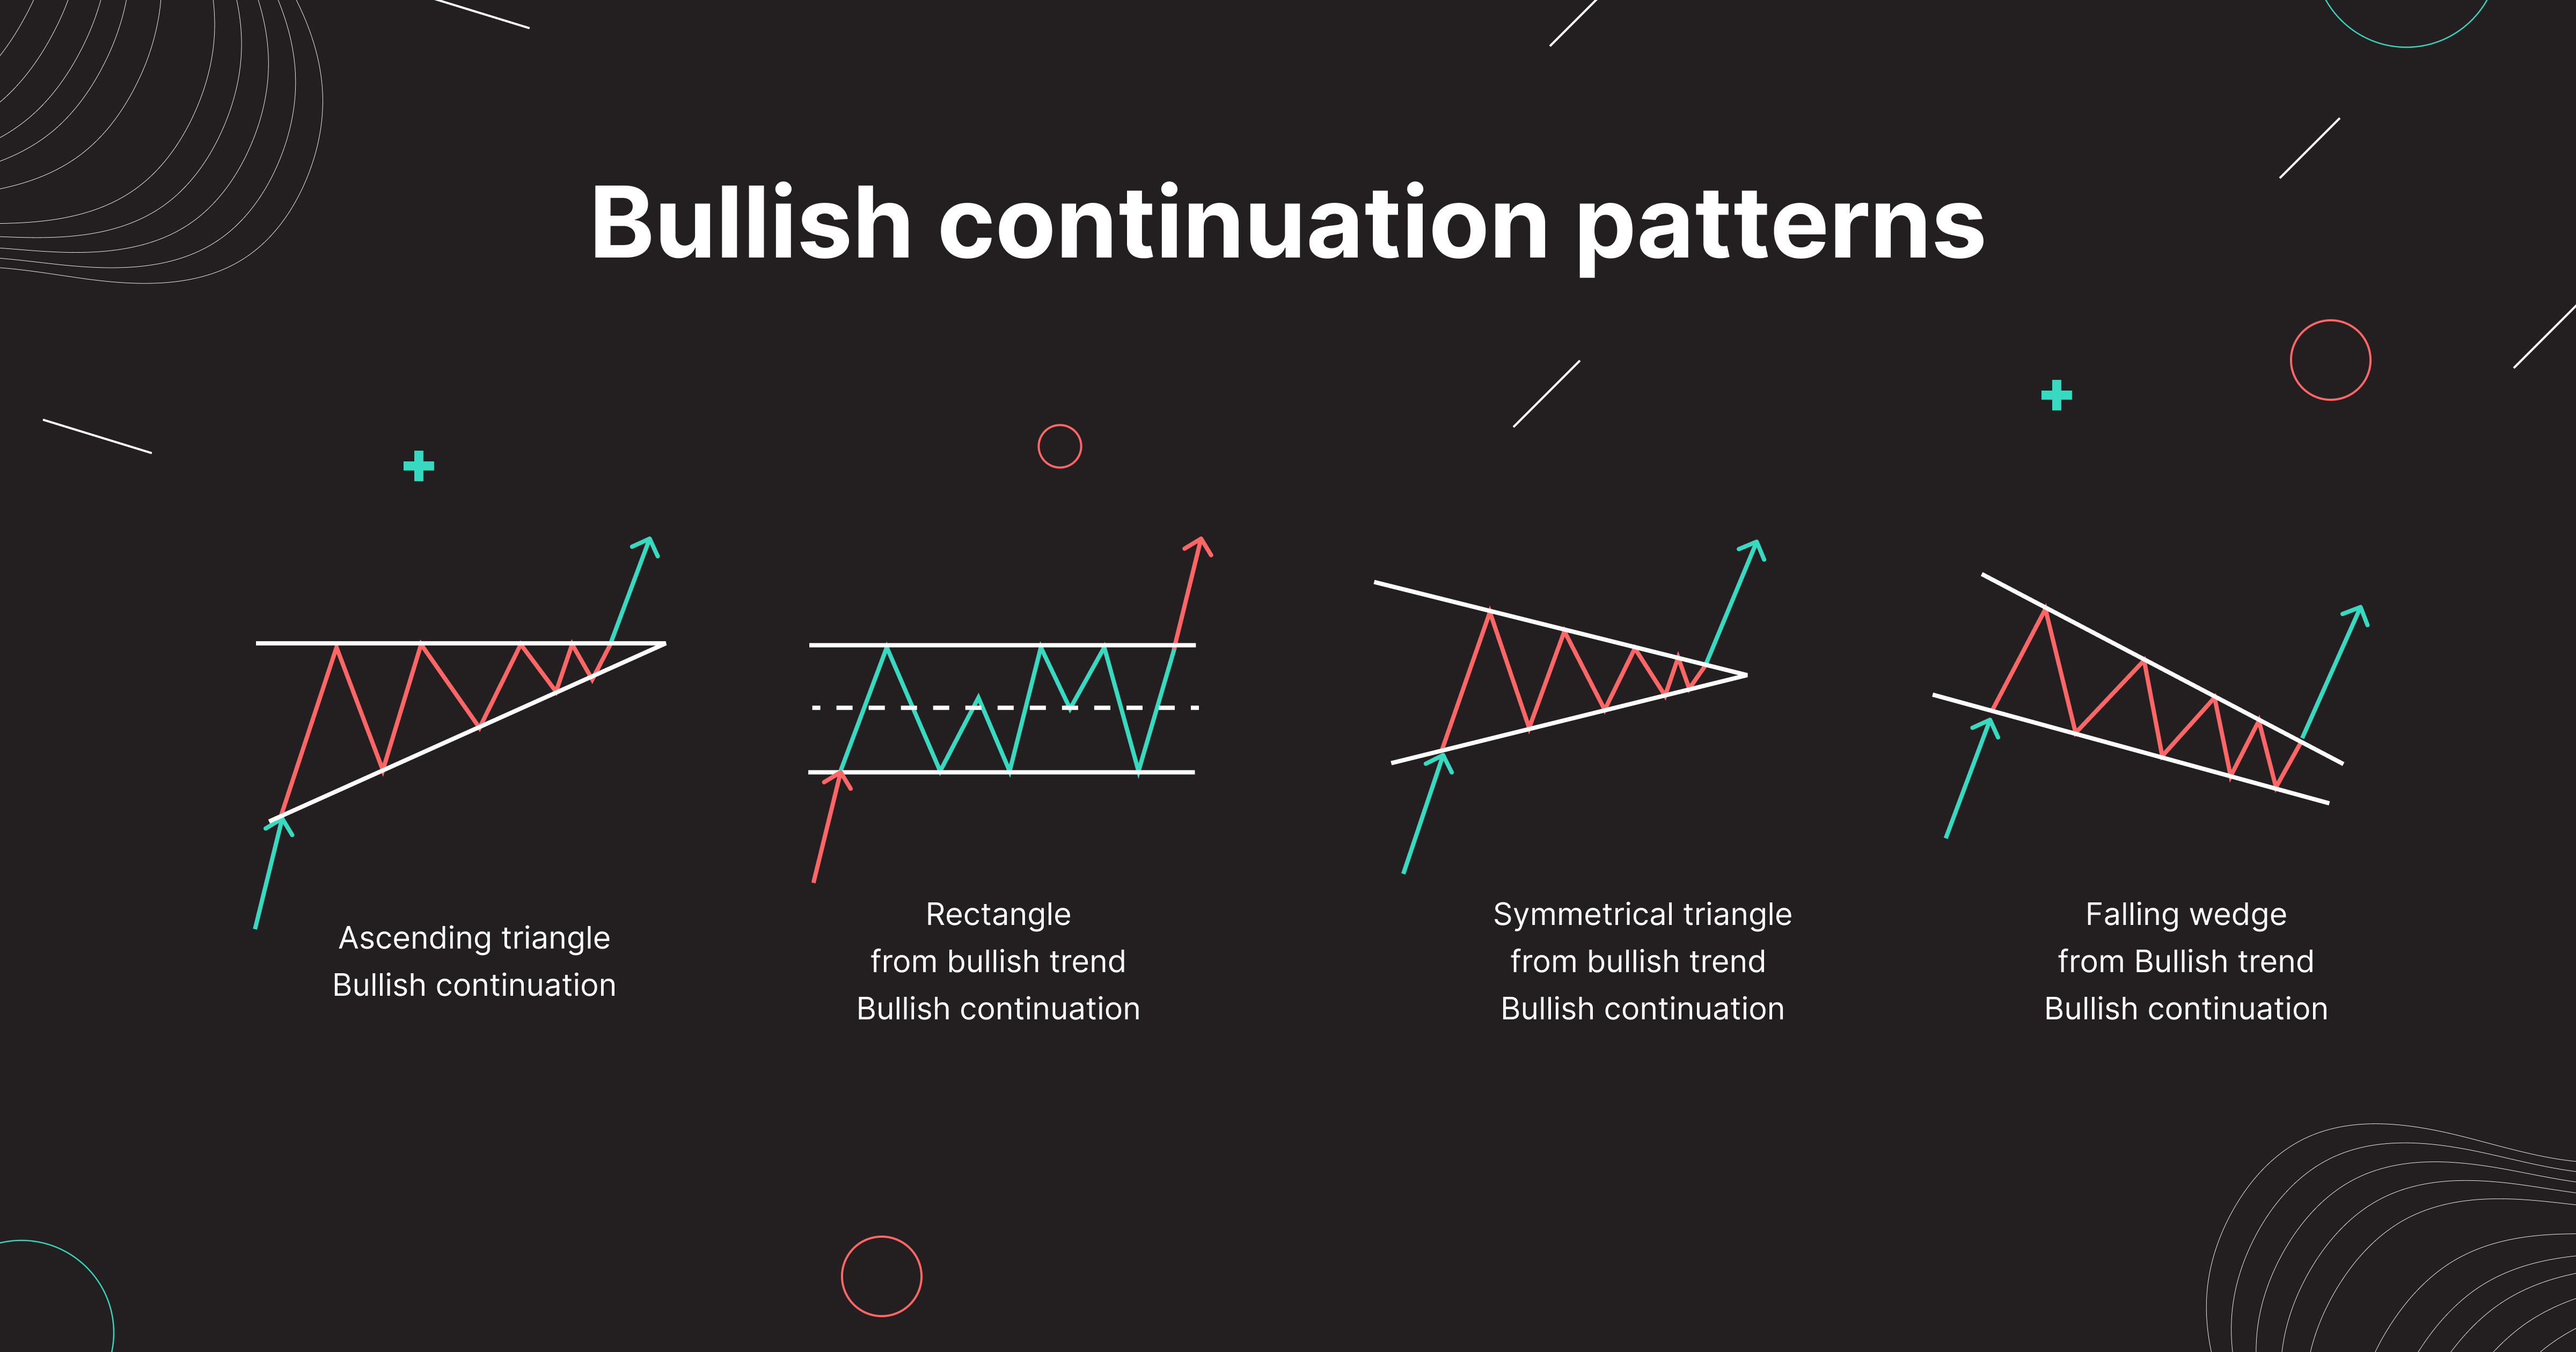
Bullish patterns are chart formations that suggest an upward price movement is likely. These patterns are formed based on price action and can indicate that buyers are gaining strength, potentially leading to a trend reversal or continuation. Identifying bullish patterns allows traders to make timely decisions about when to buy an asset, potentially maximizing profits.
2. Common bullish patterns in crypto
Here are some of the most widely recognized bullish patterns that traders look for in the crypto markets:
2.1 Head and Shoulders (Reversal Pattern)
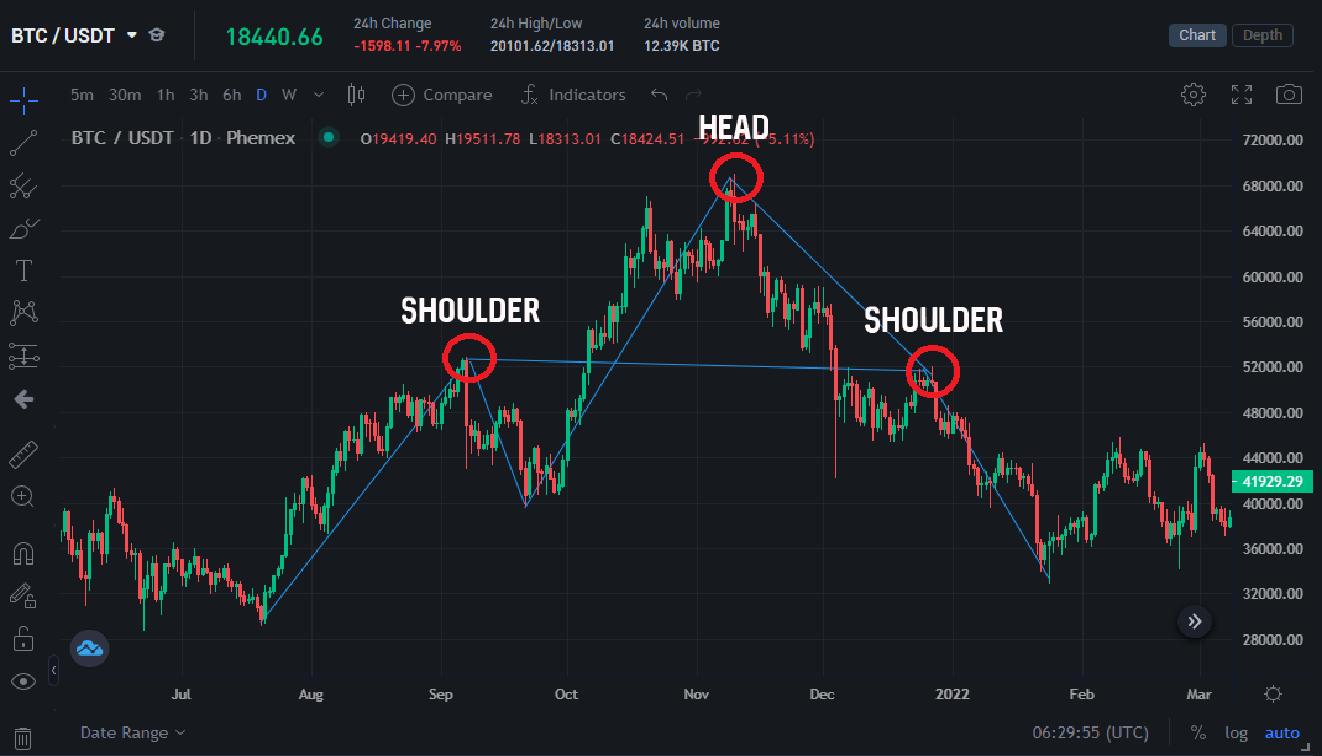
The Head and Shoulders pattern is a classic bullish reversal pattern that signals a potential shift from a downtrend to an uptrend. It consists of three peaks:
-
Left shoulder: The first peak occurs after the price starts to rise but then pulls back.
-
Head: The second peak is higher than the first and forms the "head" of the pattern.
-
Right shoulder: The third peak is lower than the head but similar in height to the left shoulder.
When the price breaks above the "neckline" (the support level formed by connecting the lows of the left and right shoulders), this breakout signals a reversal to the upside.
2.2 Inverse Head and Shoulders (Reversal Pattern)
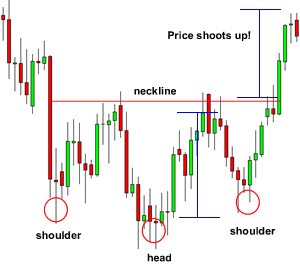
The Inverse Head and Shoulders pattern is the reverse of the regular head and shoulders pattern. It indicates a bullish reversal from a downtrend to an uptrend. The pattern looks like this:
-
Left shoulder: The price declines but then begins to rise.
-
Head: The price makes a lower low before rising again.
-
Right shoulder: The price forms another low, similar to the left shoulder.
A breakout above the neckline (the resistance level formed by connecting the peaks of the left and right shoulders) is seen as a strong indication that the price will move upward.
2.3 Double Bottom (Reversal Pattern)
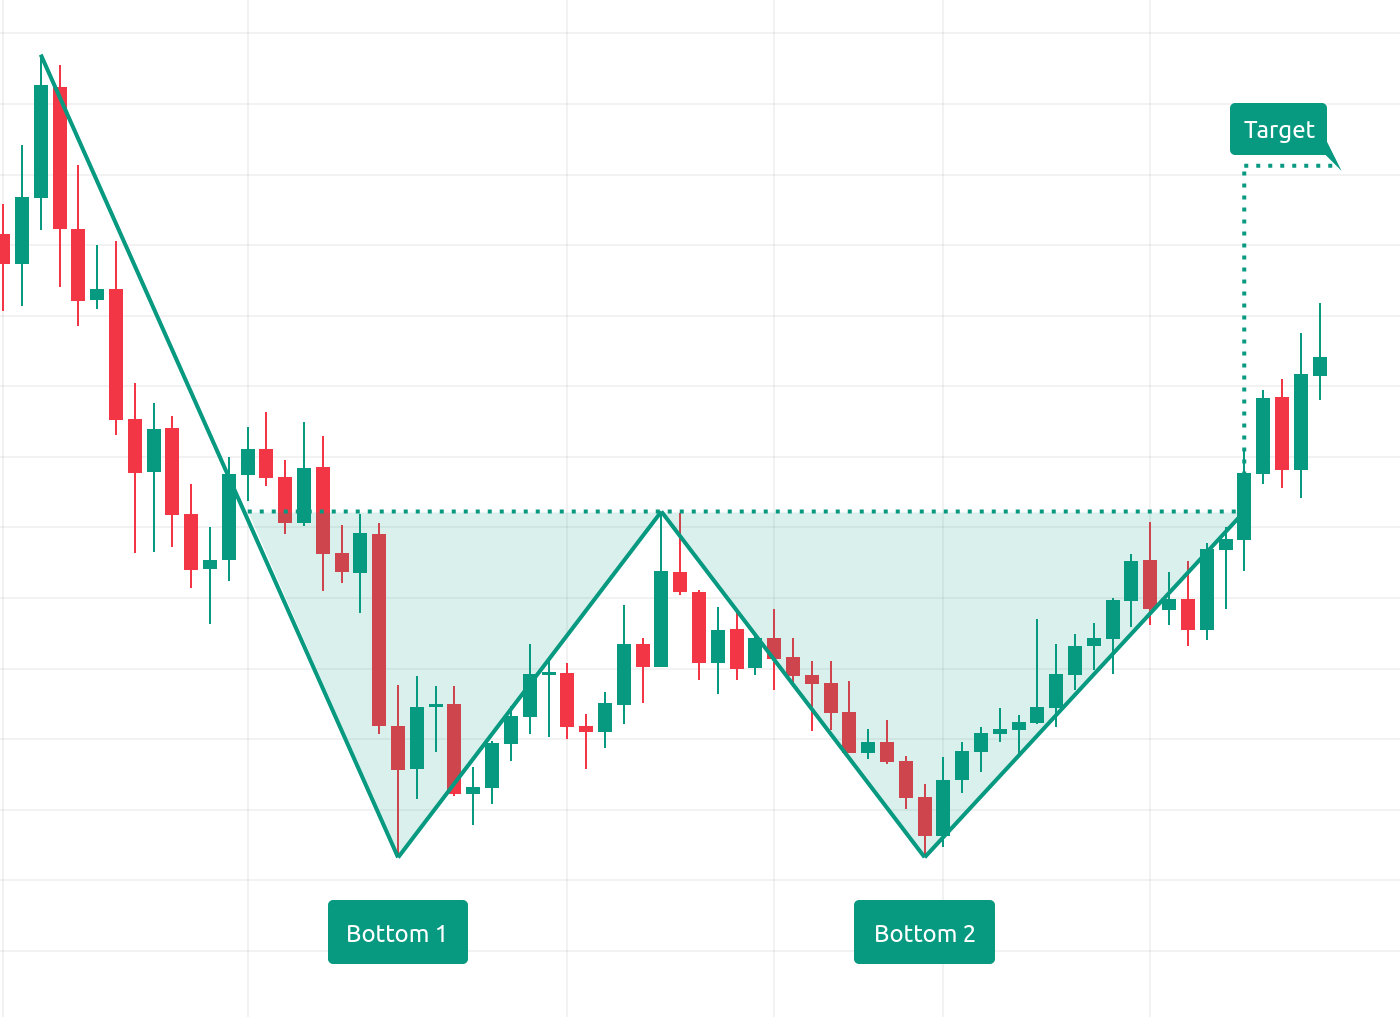
The Double Bottom pattern is another bullish reversal pattern that signals the end of a downtrend and the beginning of an uptrend. It is formed after a prolonged decline in price and looks like the letter "W." The pattern consists of:
-
First bottom: The price reaches a new low and starts to rebound.
-
Rally: The price rises but doesn't break the previous resistance level.
-
Second bottom: The price declines again to roughly the same level as the first bottom but quickly rebounds.
When the price breaks above the resistance level between the two bottoms, this breakout indicates a bullish trend reversal.
2.4 Triple Bottom (Reversal Pattern)
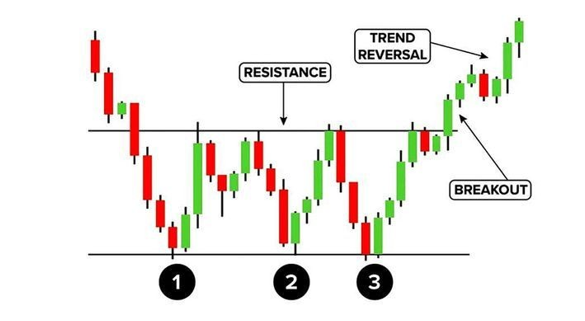
Similar to the double bottom, the Triple Bottom pattern indicates a reversal from a downtrend to an uptrend, but it consists of three bottoms instead of two. This pattern is typically more significant and confirms a stronger shift in market sentiment. It looks like the letter "M" but upside down.
When the price breaks above the resistance level that forms the middle peak, the pattern is confirmed, and an upward trend is expected.
2.5 Bullish Flag and Pennant (Continuation Patterns)
.jpg)
Bullish flags and pennants are continuation patterns that suggest the price will continue moving in the same direction after a brief consolidation.
-
Bullish Flag: A flag pattern forms after a strong upward move (called the flagpole), followed by a short consolidation where the price moves slightly downward or sideways in a parallel or slanted range. The breakout from the upper trendline of the flag signals the continuation of the bullish trend.
-
Bullish Pennant: A pennant is similar to a flag but with converging trendlines, creating a symmetrical triangle. It forms after a strong price movement, and a breakout from the upper boundary of the pennant indicates the continuation of the uptrend.
Both of these patterns are reliable indicators of continued bullish momentum when they form after an upward price move.
2.6 Cup and Handle (Continuation Pattern)
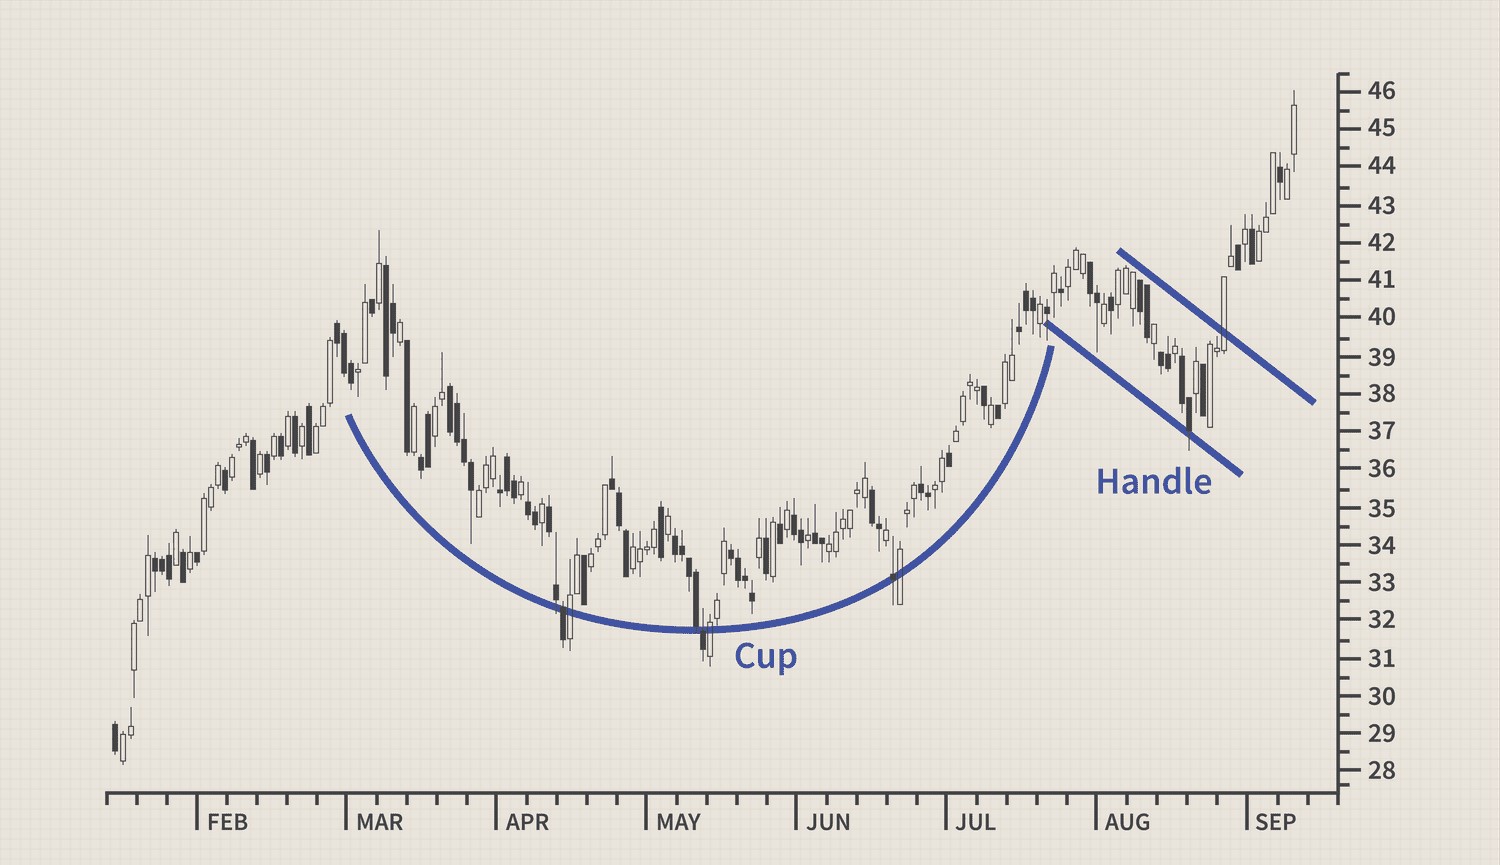
The Cup and Handle pattern is a popular continuation pattern that signals the continuation of an uptrend. It resembles the shape of a tea cup and consists of two parts:
-
Cup: The price forms a rounded bottom (a U-shape), gradually declining and then rising back up.
-
Handle: After the cup is formed, the price consolidates in a smaller downward pattern before breaking out upward.
When the price breaks above the resistance formed by the top of the cup, it confirms the bullish continuation.
2.7 Rising Three Methods (Continuation Pattern)
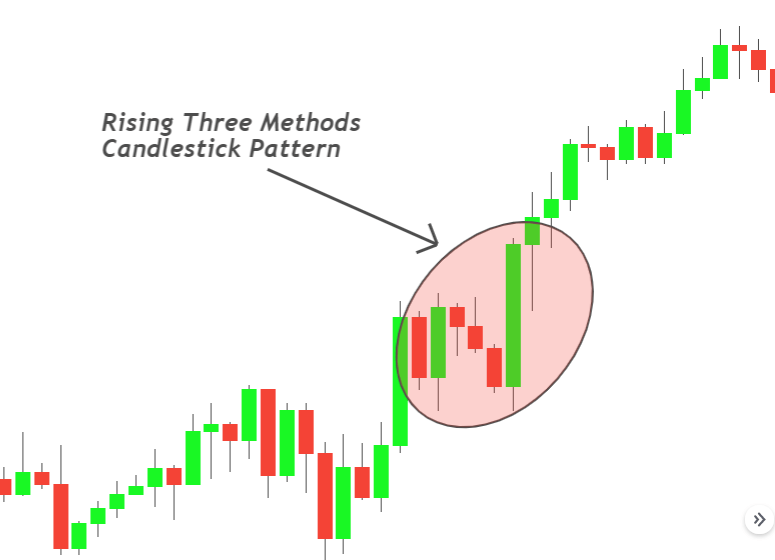
The Rising Three Methods is a continuation pattern that occurs during an uptrend and signals a brief consolidation before the trend continues. This pattern consists of:
-
A long bullish candlestick.
-
Three small bearish candlesticks that stay within the range of the first candlestick.
-
Another long bullish candlestick that closes above the high of the first candlestick.
The pattern suggests that the trend will continue after a brief period of consolidation.
2.8 Bullish Engulfing (Reversal Pattern)
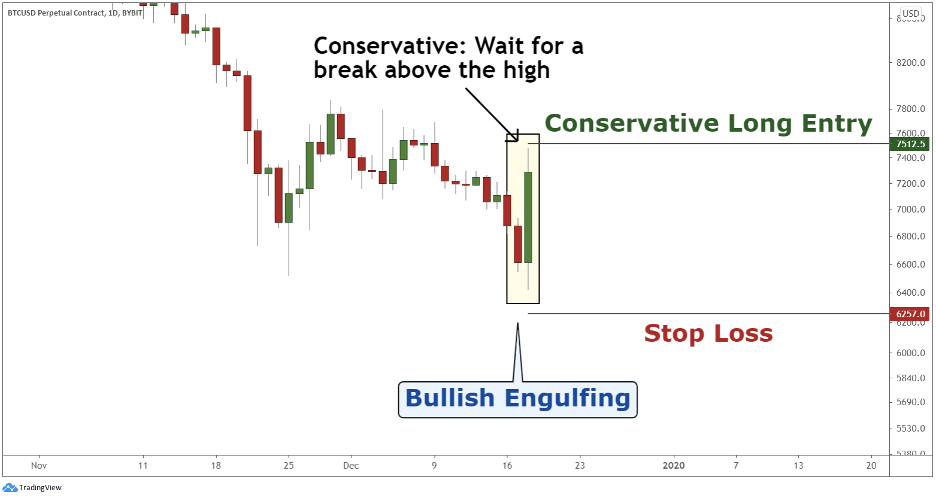
A Bullish Engulfing pattern is a candlestick pattern that signals a potential reversal from a downtrend to an uptrend. It occurs when a small bearish candlestick is followed by a large bullish candlestick that completely engulfs the previous one. The bullish candlestick signifies strong buying pressure, which can lead to an upward price movement.
3. Guide to using bullish patterns in crypto trading
.jpg)
To effectively use bullish patterns in crypto trading, consider the following tips:
-
Confirm with volume: A breakout or pattern confirmation is stronger when accompanied by high trading volume. Look for increased volume during the breakout or reversal for more reliable signals.
-
Combine with other indicators: Use other technical indicators such as moving averages, RSI (Relative Strength Index), or MACD (Moving Average Convergence Divergence) to confirm the bullish patterns and ensure they align with broader market trends.
-
Set stop-loss orders: While bullish patterns can provide strong trading opportunities, it's essential to manage risk. Always set a stop-loss to protect your investments in case the market moves against you.
-
Monitor the overall market trend: Bullish patterns are more reliable when the overall market is in an uptrend. If the market is in a downtrend, bullish patterns may signal temporary retracements rather than long-term price reversals.
4. Conclusion
Bullish patterns are powerful tools in crypto trading that help traders identify potential upward price movements. Whether you're looking for a trend reversal with patterns like the Inverse Head and Shoulders or seeking to ride the momentum with bullish flags or cup and handle patterns, recognizing these chart formations can significantly improve your trading strategy.
As with any technical analysis tool, it's essential to use these patterns in combination with other indicators, risk management techniques, and proper market research to make well-informed decisions. By mastering the bullish patterns in crypto, you can increase your chances of success in this fast-paced and highly volatile market.
Read more:

 English
 Tiếng Việt
.png)
.jpg)

.jpg)
.jpg)
.jpg)

.jpg)
.jpg)

.jpg)
.jpg)
.jpg)


