English
 Tiếng Việt
1. Candlesticks and Their Significance in Cryptocurrency Trading
1.1. What is a Candlestick?
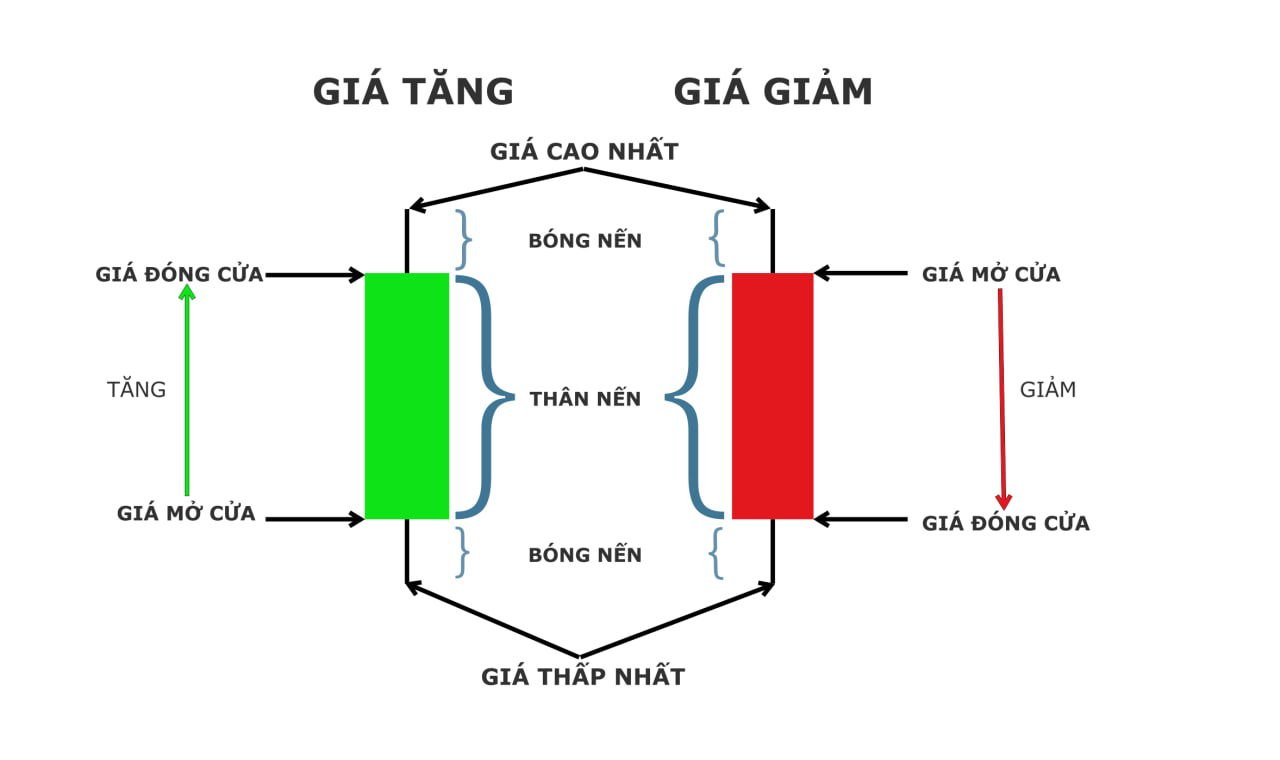
A candlestick indicates the price changes of an asset over a set period. As a fundamental indicator in cryptocurrency charts, each candlestick represents a specific price movement, including the opening and closing prices, as well as the highest and lowest points.
Since cryptocurrency is traded 24/7, unlike the stock market, the opening and closing prices typically refer to the start and end of a day.
When these candlesticks are placed in sequence, they form a chart showing the asset's historical price fluctuations.
1.2. Structure of a Candlestick
Candlesticks on a cryptocurrency chart consist of two main parts:
-
The Body: This thick bar represents the asset's opening and closing prices. In most chart configurations, a green body indicates a period of price increase, while a red body indicates a price decrease.
-
The Wick (or Shadow): This thin line shows the highest and lowest price points during a specific period. The wick usually has the same color as the body in most chart configurations, including on cryptocurrency exchange charts.
1.3. The Importance of Candlesticks in Trading Charts
Many traders prefer using candlestick charts over line charts because they provide a more detailed picture of an asset's price fluctuations, both historical and recent. Each candlestick displays the opening, closing, high, and low prices, and a group of candlesticks offers more insights into price activity.
Candlesticks reveal nuances that regular line charts do not, such as the distance between the closing price and the highest point at the end of a specific period, or the extent of an asset's volatility over specific trading intervals.
2. Introduction to Candlestick Charts in Technical Analysis
Candlestick charts are used in technical analysis to display the price movements of financial assets (like stocks, cryptocurrencies, or commodities) over a defined period.
These charts provide a visual and intuitive way to track price fluctuations and market trends. Traders often rely on candlestick charts to make trading decisions based on candlestick patterns and price action.
The information that a simple candlestick can provide about an asset's price movement is a fundamental aspect of technical analysis in cryptocurrency trading.
Technical analysis involves using chart patterns, trading volume, and other market-based information to determine the next move for a trader.
In fact, many well-known technical indicators in cryptocurrency trading are based on how combinations of candlesticks appear on the chart.

3. Understanding Common Candlestick Patterns in Crypto
There are dozens of different candlestick patterns to learn, but before diving into details, let's explore some key terms and concepts to help you better understand candlesticks.
3.1. Bullish or Bearish Patterns
The primary question most crypto traders consider daily is: "Will the price go up or down?" Therefore, the most interesting candlestick patterns for traders are those that can predict upward or downward movement.
- A bullish candlestick pattern appears after a series of price declines and before an upward trend.
- A bearish candlestick pattern appears at the peak of a price increase and precedes a downward trend.
Note that the direction of the pattern is not based on the color it displays. Each pattern has its own price context that may "lean" bullish or bearish on the chart.
3.2. Single or Multiple Candlestick Patterns
Some individual candlesticks are considered strong enough signals to indicate potential trend changes. These are known as single candlestick patterns.
However, most candlestick patterns belong to the category of multiple candlestick patterns. To detect price trends, you need to familiarize yourself with patterns displayed by two or more consecutive candlesticks to identify potential price movements.
3.3. Reversal or Continuation Patterns
Many candlestick patterns focus on changes in price direction, specifically whether a rising asset is likely to drop soon or if a falling token may change course and recover. These are known as reversal patterns.
Not all patterns, however, signal a change in price direction. Other candlestick patterns can be used to confirm the current trajectory of an asset's price. These are called continuation patterns, and detecting them can help traders decide whether to keep investing in that direction.
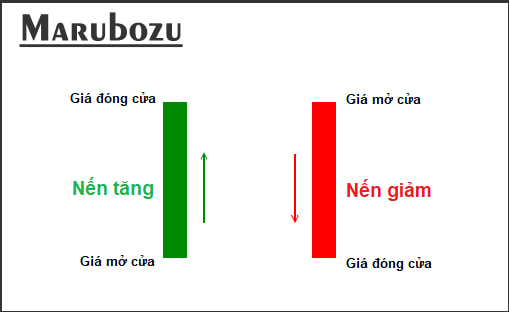
3.4. Bullish Marubozu
The appearance of this candlestick can be interpreted as traders wanting to buy an asset at any price point during that period, indicating an overall positive market sentiment. This may suggest a potential upward trend to follow.
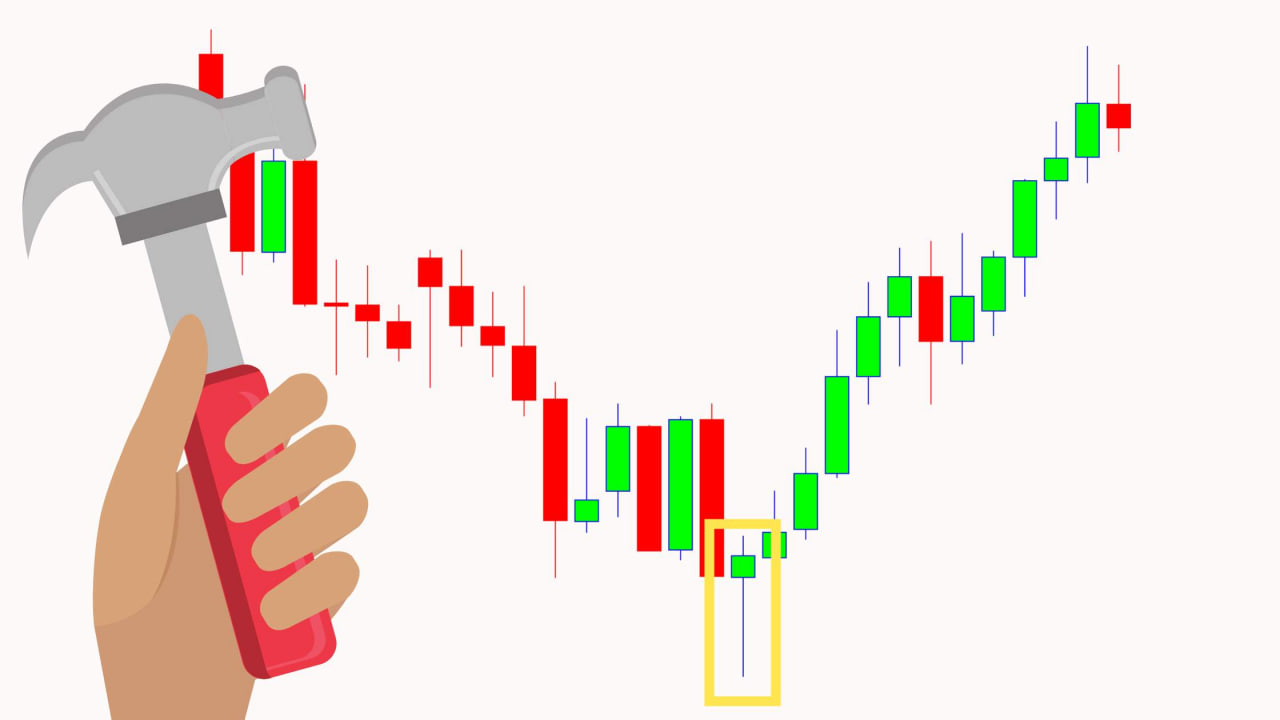
3.5. Hammer
Another noteworthy candlestick is the hammer. It features a short upper body, a long lower wick, and little to no upper wick, resembling this tool.
When a hammer appears after a series of declining candlesticks, it may signal an upcoming price increase. A hammer following a downtrend suggests that despite downward price volatility, the opening and closing prices are close, indicating a potential bottom and a chance for the market to reverse.
Other examples of bullish single candlestick patterns include the dragonfly doji and spinning top.
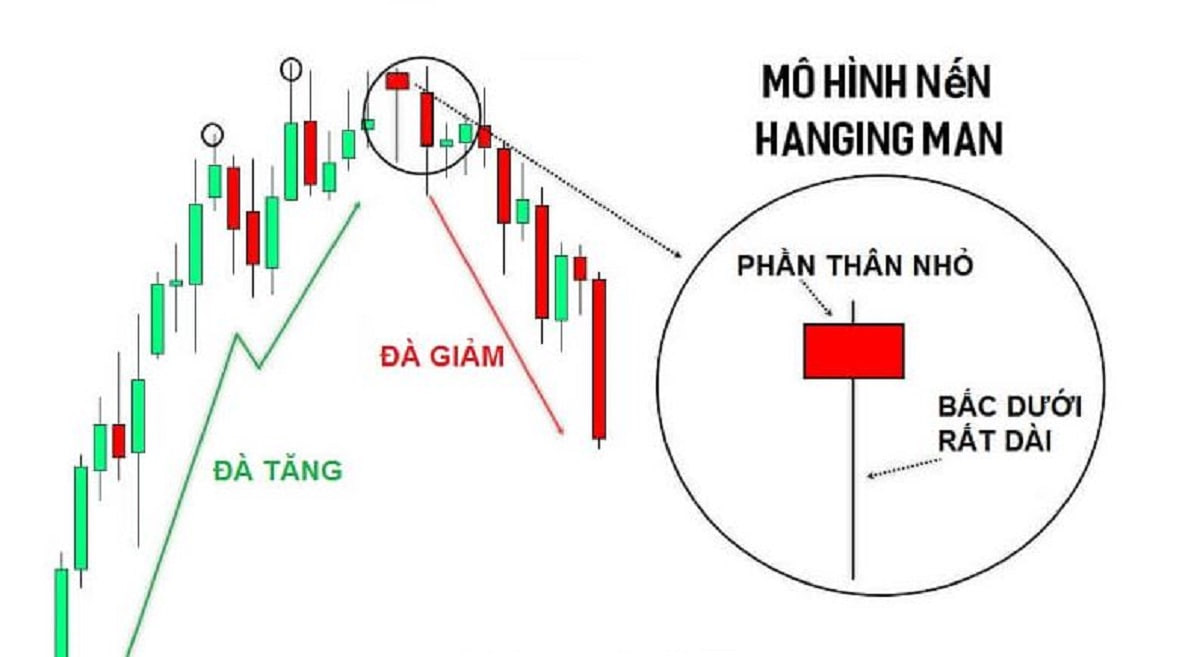
3.6. Hanging Man
The hanging man pattern typically indicates that prices changed slightly during that period after a series of increases, with significant downward swings, suggesting a potential decline in the future.
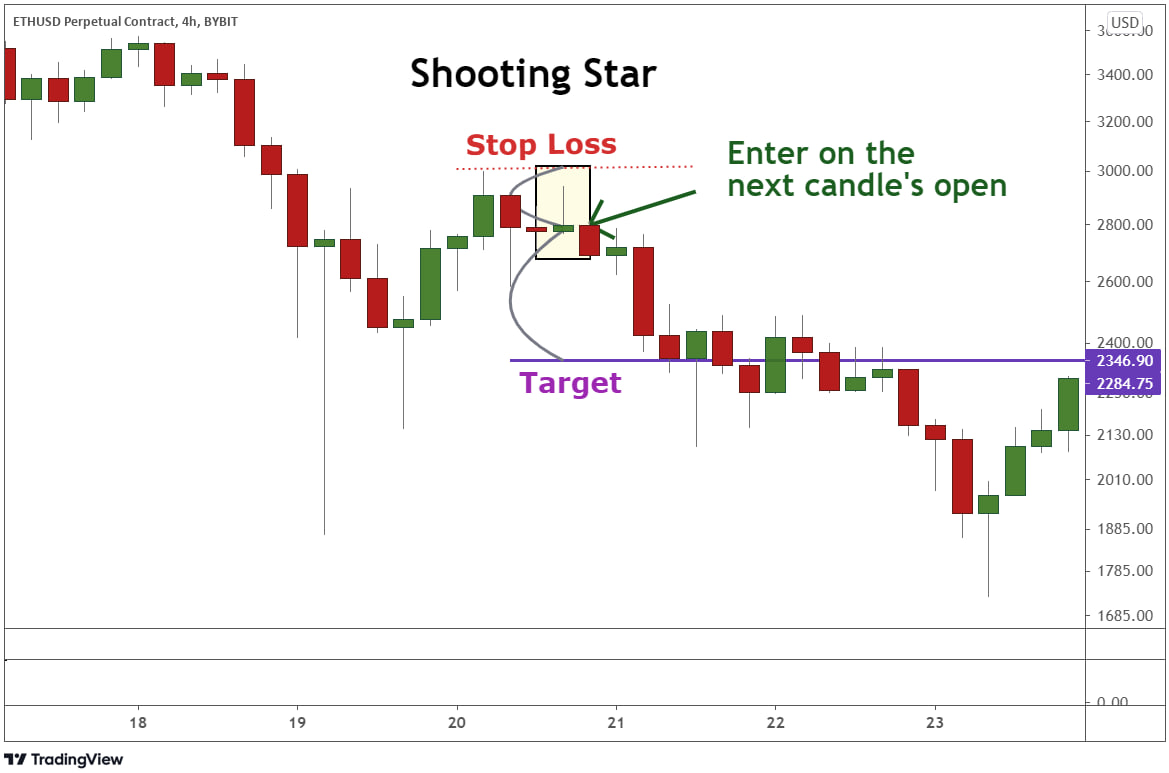
3.7. Shooting Star
A bearish candlestick worth noting is the shooting star, which is essentially an inverted hanging man. It has a short lower body, little to no wick, and a long upper wick, resembling a star leaving a trail as it falls. When the shooting star appears after consecutive bullish patterns, it indicates only slight price changes during that period, despite reaching significantly higher levels before the closing rate.
This pattern can be interpreted as a signal that prices may struggle to rise further and may fall soon. Other examples of bearish single candlestick patterns include the gravestone doji, spinning top, and bearish marubozu.
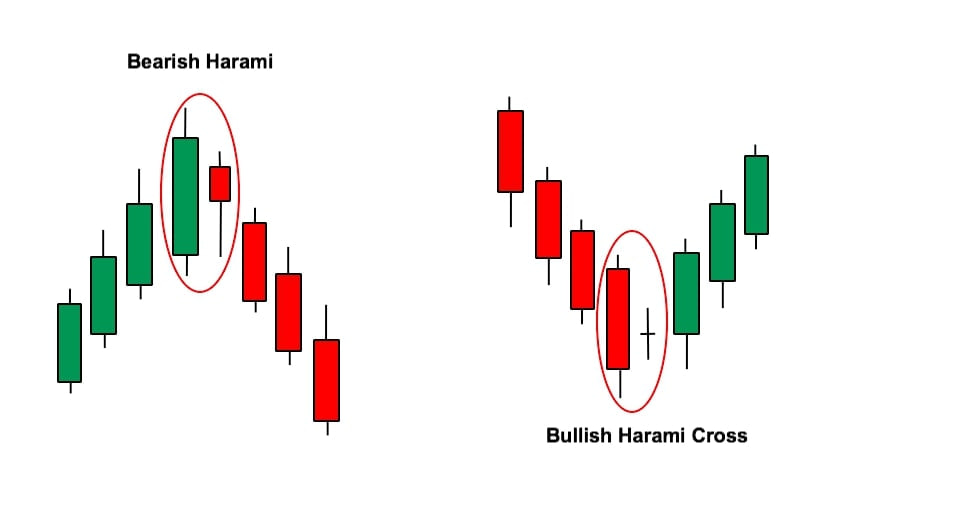
3.8. Bullish Harami
An example involving a pair of candlesticks is the bullish harami, characterized by a large bearish candlestick followed by a smaller bullish one entirely within the range of the bearish candlestick's body. "Harami" is a Japanese word meaning 'pregnant,' as the pair resembles a pregnant figure. This pattern indicates a strong price decline followed by a minor recovery within the previous decline's range.
This combination can be interpreted as a bullish signal, suggesting further potential price increases.
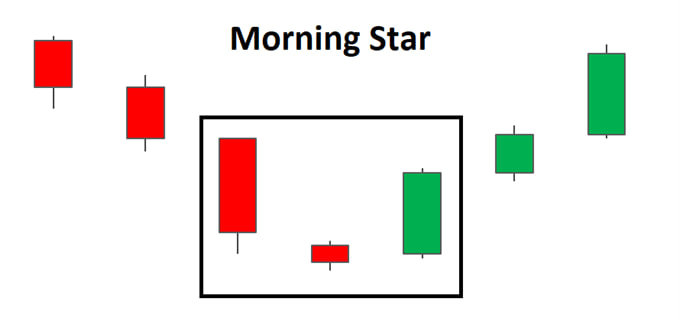
3.9. Morning Star
For example, the morning star consists of a bearish candlestick, followed by a doji, and then a bullish candlestick. The presence of a doji between the bullish and bearish candles suggests a period of stable prices despite significant volatility during that time. This candlestick combination signals a trend reversal from bearish to bullish.
4. Notes for Crypto Investors When Reading Candlestick Charts
When reading candlestick charts in crypto trading, investors should keep the following points in mind to make accurate decisions and minimize risks:
4.1. Understanding the timeframes
Different candlestick chart timeframes provide various perspectives on price movements. For example, a daily candlestick shows the price movements within one day, while a weekly candlestick shows the price changes over a week. It's crucial to choose the appropriate timeframe based on your trading strategy.
4.2. Avoid relying solely on candlestick patterns
While candlestick patterns can provide valuable insights into price trends, they should not be the only factor used in decision-making. Combining candlestick analysis with other technical indicators, such as moving averages, Relative Strength Index (RSI), or trading volume, will help you make more informed trading decisions.
4.3. Consider market conditions and news
Market conditions and news events can significantly impact the effectiveness of candlestick patterns. Major news about a specific cryptocurrency or regulatory developments can cause sudden price fluctuations, which may make candlestick patterns less reliable.
4.4. Practice reading candlestick charts regularly
The ability to recognize and understand candlestick patterns improves with regular practice. The more you practice reading candlestick charts, the more adept you will become at spotting potential market trends and making timely trading decisions.
Understanding candlestick charts is a fundamental skill for anyone involved in cryptocurrency trading. By mastering the key patterns and interpreting them within the context of market conditions, investors can make more informed decisions, manage risks better, and potentially increase their chances of success in the crypto market.
5. Conclusion
Using candlestick charts can be a good starting point in your cryptocurrency trading journey, as they can help you assess the likelihood of price changes. Each candlestick pattern tells a short-term story about market sentiment and the decisions being made. Since candlesticks are the most easily accessible indicators, they can enhance your understanding of price action, especially when combined with other technical analysis indicators.
That said, candlesticks should never be considered as precise indicators for your trades, no matter how experienced you are in cryptocurrency trading, particularly if you start trading in larger volumes.
Candlestick patterns do not serve as absolute predictions of future price movements, and there are countless instances where the market moves in the opposite direction from what the patterns suggest.
Read more: