English
 Tiếng Việt
1. What are Crypto Trading Indicators?
Crypto trading indicators are mathematical calculations based on the price, volume, or open interest of a cryptocurrency. These indicators help traders analyze market data and identify patterns, trends, and potential signals to either enter or exit trades. In essence, they simplify the data from the market and offer actionable insights that can help traders predict future price movements.
Trading indicators are categorized into several types, primarily:
-
Trend Indicators: Help identify the direction of the market (uptrend, downtrend, sideways).
-
Momentum Indicators: Measure the speed or strength of a price move.
-
Volatility Indicators: Assess the level of price fluctuations over a certain period.
-
Volume Indicators: Focus on the trading volume to gauge market participation.
-
Market Strength Indicators: Help assess the overall health or strength of a trend.
Each indicator has its strengths and weaknesses, and no single indicator is foolproof. Successful crypto traders often use a combination of indicators to confirm signals, reduce false positives, and develop more reliable trading strategies.
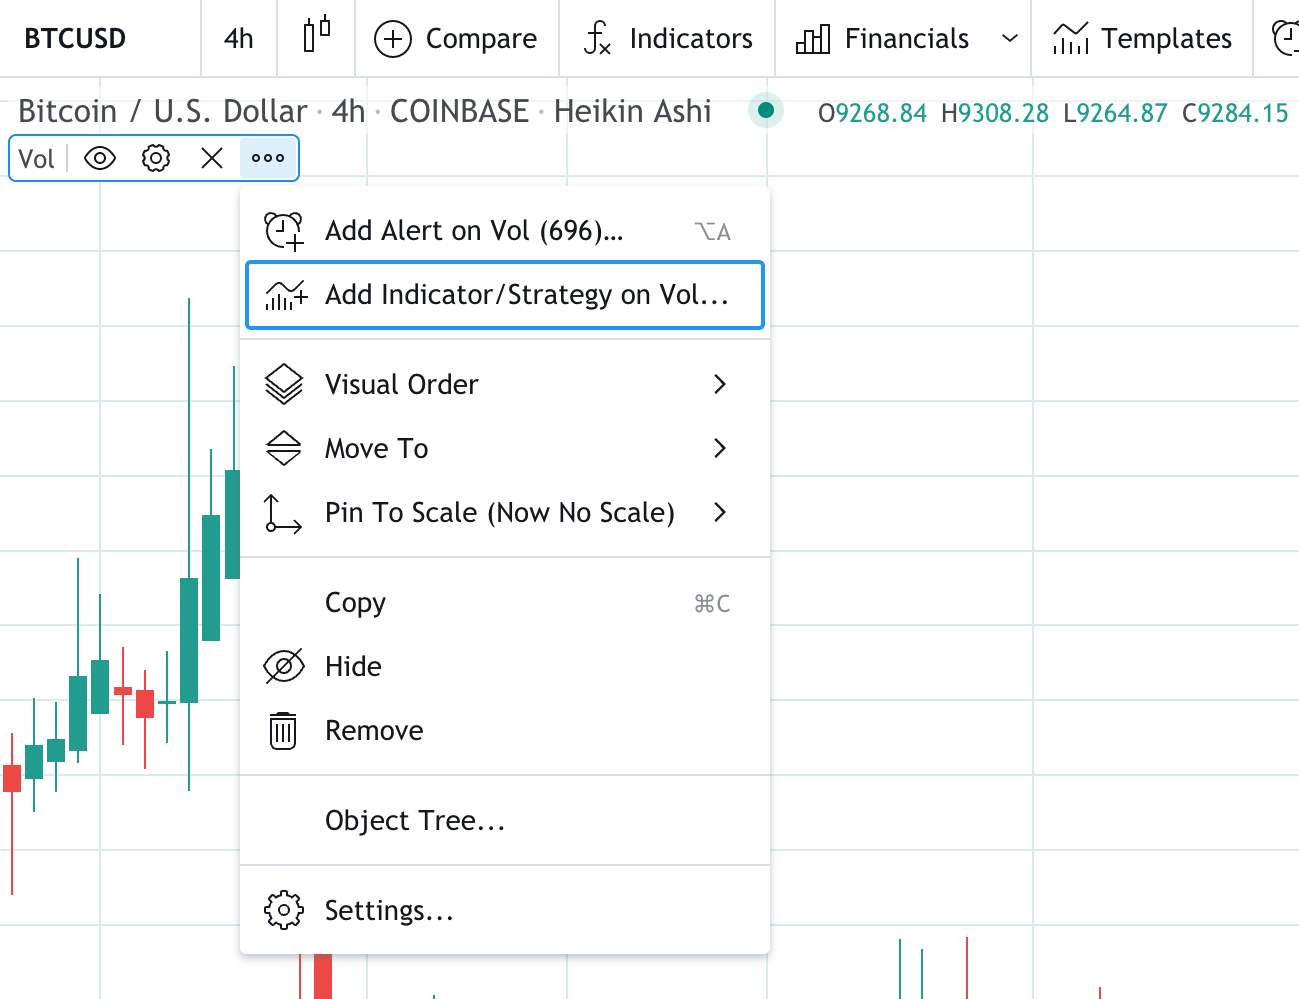
2. Key crypto trading indicators and their functions
.png)
Let’s dive into some of the most commonly used indicators in cryptocurrency trading and explore how they function.
a) Moving Averages (MA)
One of the most fundamental indicators in technical analysis, moving averages help smooth out price data to identify trends over a specific period. There are two main types:
-
Simple Moving Average (SMA): The average of the closing prices over a set period (e.g., 50 days).
-
Exponential Moving Average (EMA): Places more weight on recent price data, making it more sensitive to price movements than the SMA.
How It Works: Moving averages can be used to identify bullish or bearish trends. When the price is above the moving average, it suggests an uptrend, while when the price is below the moving average, it indicates a downtrend. Additionally, crossovers between short-term and long-term moving averages (e.g., the 50-day and 200-day) are often used as buy or sell signals.
b) Relative Strength Index (RSI)
The Relative Strength Index (RSI) is a momentum oscillator that measures the speed and change of price movements. The RSI ranges from 0 to 100 and is typically used to identify overbought or oversold conditions in the market.
-
Overbought: RSI above 70, suggesting the asset may be overbought and due for a price correction.
-
Oversold: RSI below 30, suggesting the asset may be oversold and could be set for a rebound.
How It Works: Traders use the RSI to predict potential price reversals. For example, when the RSI enters overbought or oversold territory, it could signal a potential trend reversal. Divergences between the RSI and price action are also seen as potential reversal indicators.
c) Moving Average Convergence Divergence (MACD)
The MACD is a trend-following momentum indicator that shows the relationship between two moving averages of an asset’s price. It consists of the MACD line, signal line, and histogram, which help identify changes in the strength, direction, momentum, and duration of a trend.
-
MACD Line: The difference between the 12-day EMA and the 26-day EMA.
-
Signal Line: A 9-day EMA of the MACD line.
-
Histogram: Represents the difference between the MACD line and the signal line.
How It Works: MACD crossovers (when the MACD line crosses above or below the signal line) are often used as buy or sell signals. Additionally, the divergence between the MACD and price action can signal potential trend reversals.
d) Bollinger Bands
Bollinger Bands consist of three lines:
-
Middle Band: A simple moving average (SMA), typically set to a 20-day period.
-
Upper Band: The middle band plus two standard deviations.
-
Lower Band: The middle band minus two standard deviations.
How It Works: Bollinger Bands measure volatility by depicting the price range within which the market is likely to trade. When the bands contract, it indicates lower volatility and the possibility of a breakout, while an expansion of the bands suggests increased volatility. Price touching the upper band can suggest overbought conditions, while price nearing the lower band suggests oversold conditions.
e) Volume-Weighted Average Price (VWAP)
VWAP is an indicator that gives the average price of a cryptocurrency, weighted by volume, over a specific time period. VWAP is often used to assess the price levels at which large institutions are buying or selling and is commonly used in intraday trading.
How It Works: VWAP is particularly helpful in determining whether the current price of an asset is above or below its average trading price for a given time period. If the price is above the VWAP, it suggests bullish sentiment, while if the price is below the VWAP, it suggests bearish sentiment. VWAP is widely used by institutional traders to place orders with minimal price impact.
f) Fibonacci Retracement Levels
Fibonacci retracement is a tool used to identify potential support and resistance levels in the market. These levels are based on key Fibonacci numbers (23.6%, 38.2%, 50%, 61.8%, and 100%) and are used to predict where price corrections may end and the previous trend may resume.
How It Works: Traders use Fibonacci retracement levels to identify areas where price pullbacks may occur. For example, if a crypto asset has been in a strong uptrend, a retracement to one of these Fibonacci levels could provide an entry point for a long trade, with the expectation that the trend will continue.
g) Ichimoku Cloud
The Ichimoku Cloud is a comprehensive indicator that provides information about support and resistance, trend direction, momentum, and potential entry/exit points. It consists of five components:
-
Tenkan-sen (conversion line)
-
Kijun-sen (base line)
-
Senkou Span A (leading span A)
-
Senkou Span B (leading span B)
-
Chikou Span (lagging span)
How It Works: The Ichimoku Cloud is used to identify the overall trend and support/resistance levels. When the price is above the cloud, it signals a bullish trend, while prices below the cloud indicate a bearish trend. The cloud itself also serves as a dynamic support/resistance zone, and crossovers between the Tenkan-sen and Kijun-sen lines provide potential trade signals.
3. How to combine crypto trading indicators
While individual crypto trading indicators are valuable, combining them can increase the reliability of trading signals and reduce the likelihood of false positives. For example:
-
MACD + RSI: A MACD crossover combined with an overbought/oversold condition on the RSI can provide a stronger confirmation of potential price reversals.
-
Moving Averages + Bollinger Bands: If the price is above the moving average and the price reaches the upper Bollinger Band, this may signal that the asset is overbought, and a correction could be imminent.
-
Volume + Price Action: High trading volume accompanying significant price moves often indicates the strength of the trend. Low volume during a price move could signal a weak trend and a potential reversal.
4. Conclusion
Crypto trading indicators are essential tools that can help traders make more informed decisions in the highly volatile and fast-moving cryptocurrency markets. By using a combination of indicators, traders can gain deeper insights into market trends, momentum, volatility, and potential price movements. However, it’s important to remember that no indicator is perfect, and traders should always combine technical analysis with sound risk management strategies. When used properly, crypto trading indicators can significantly improve the likelihood of making profitable trades in this dynamic market.
Read more:
.png)