English
 Tiếng Việt
1. Continuation chart patterns in Crypto Trading
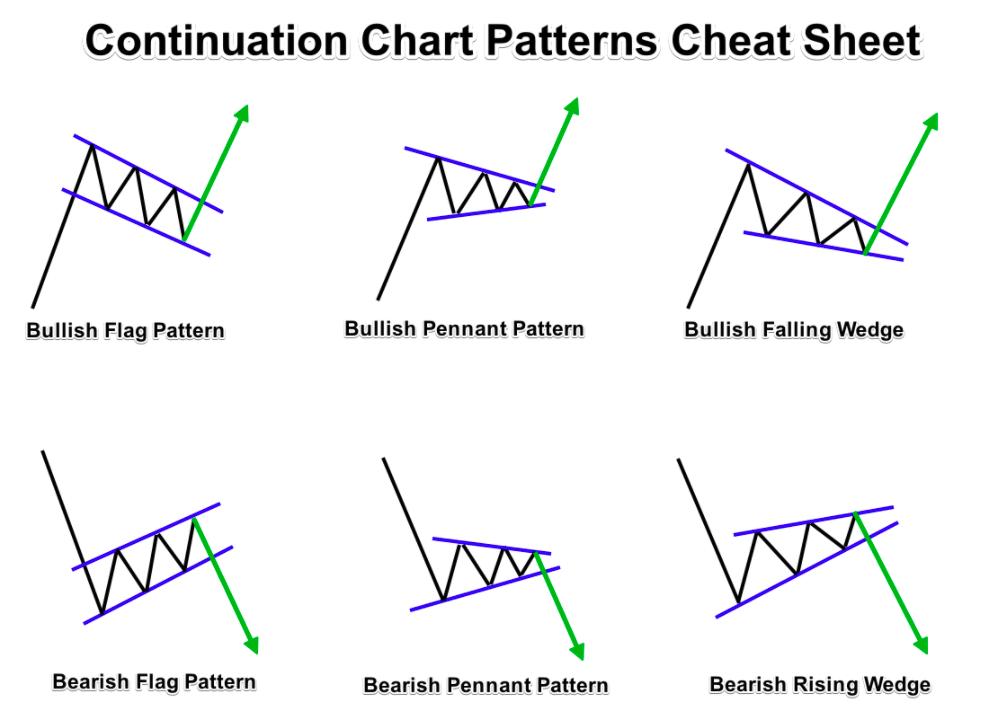
Continuation patterns indicate that the current trend (either up or down) is likely to continue once the pattern has completed. These patterns suggest temporary consolidation or a pause in the trend, after which the price typically resumes in the same direction as the pre-existing trend.
1.1. Flags and Pennants
-
Flag Pattern: A flag pattern looks like a small rectangle that slopes against the prevailing trend. It’s characterized by a steep price move (the flagpole), followed by a consolidation phase (the flag). Flags are usually short-term and indicate that the prevailing trend is likely to continue.
-
Bullish Flag: Occurs after a sharp upward move. The price then consolidates in a downward-sloping channel before breaking out upward.
-
Bearish Flag: Forms after a sharp decline in price, followed by a consolidation in an upward-sloping channel before continuing the downward trend.
-
Pennant Pattern: Similar to flags, pennants are small symmetrical triangles that form after a strong price movement. Pennants are consolidation areas where the price narrows before continuing in the direction of the previous trend.
1.2 Triangles
Triangles are some of the most common continuation patterns in crypto trading. They are formed when the price consolidates into a tightening range, typically between two trendlines that form the triangle shape.
-
Ascending Triangle: A bullish continuation pattern formed by a flat upper trendline and an ascending lower trendline. The breakout typically occurs to the upside when the price breaks above the horizontal resistance level.
-
Descending Triangle: A bearish continuation pattern formed by a flat lower trendline and a descending upper trendline. A breakdown through the support level typically signals a continuation of the downward trend.
-
Symmetrical Triangle: A neutral continuation pattern where both the upper and lower trendlines converge at a point. It indicates a period of consolidation before a breakout in either direction. The breakout direction can be determined by the preceding trend and the eventual breakout from the triangle.
2. Reversal Patterns in Crypto Trading
Reversal patterns signal a potential change in trend direction. They are crucial for predicting trend shifts, especially in highly volatile markets like cryptocurrency. These patterns form after an extended trend and suggest that the price may soon reverse course.
2.1 Head and Shoulders
-
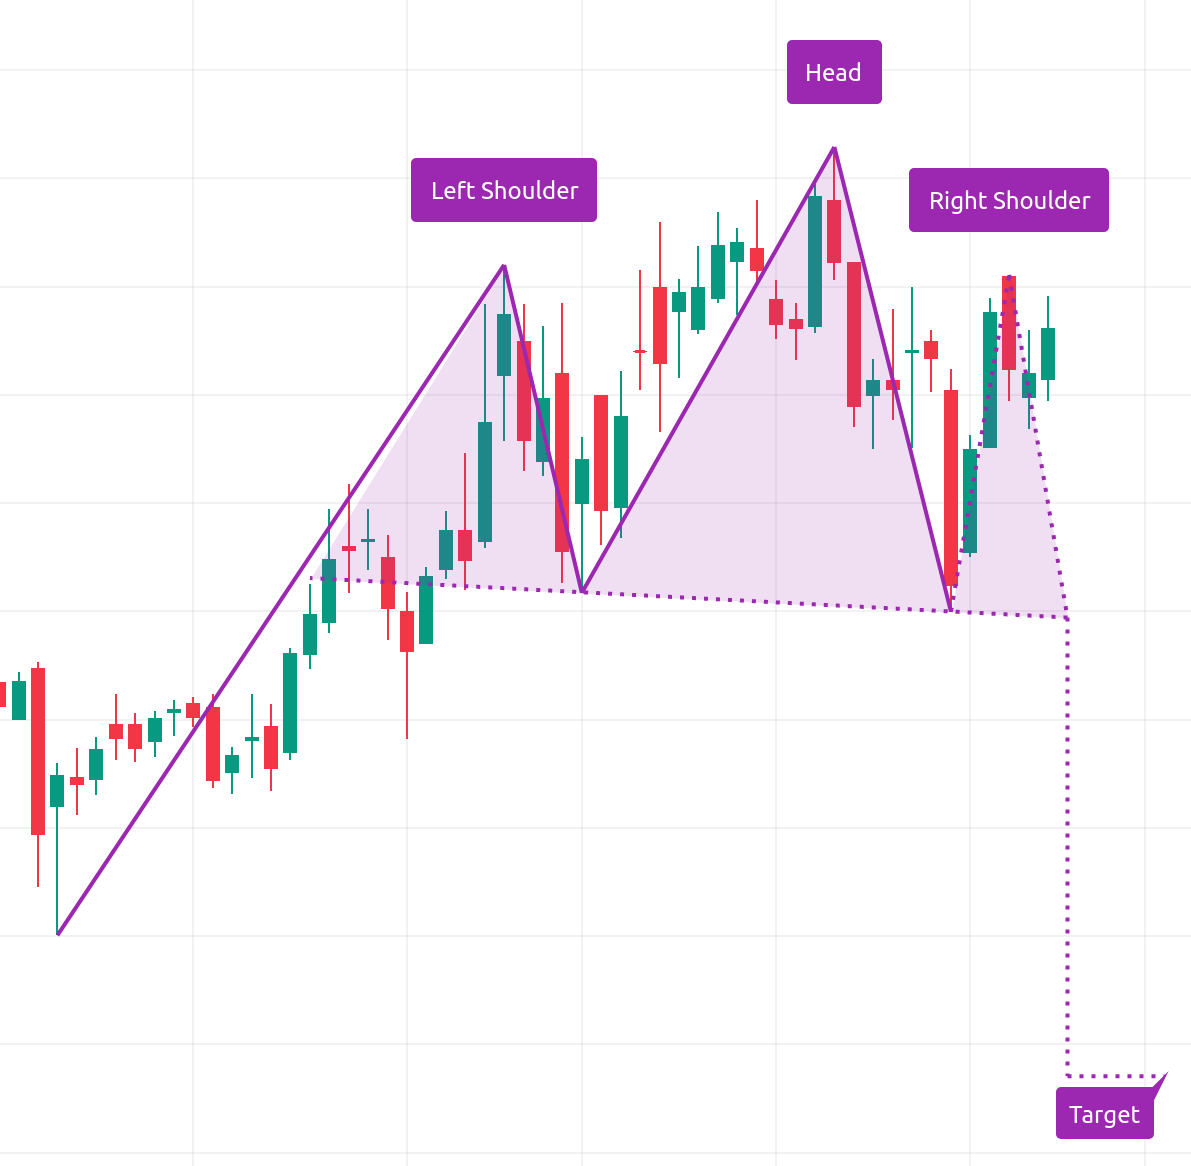
Head and Shoulders (H&S): This is a highly reliable bearish reversal pattern. It consists of three peaks: a higher peak (the head) in the middle, with two lower peaks (the shoulders) on either side. The pattern signals a reversal of an uptrend to a downtrend when the price breaks below the neckline formed by connecting the lows of the two shoulders.
-
Inverse Head and Shoulders (IH&S): The inverse version of this pattern indicates a reversal of a downtrend to an uptrend. It has a similar structure but in the opposite direction (a trough at the center, flanked by two smaller troughs).
2.2 Double Top and Double Bottom
-
Double Top: A bearish reversal pattern formed after a prolonged uptrend. The price makes two peaks at roughly the same level, with a trough in between. A break below the trough (neckline) signals a potential price reversal to the downside.
-
Double Bottom: A bullish reversal pattern that occurs after a downtrend. The price makes two troughs at approximately the same level, with a peak between them. A break above the peak (neckline) suggests the trend could reverse to the upside.
2.3 Triple Top and Triple Bottom
-
Triple Top: A more complex version of the double top, where the price attempts to rise to a new high three times, but fails each time. It signals a bearish reversal when the price breaks below the support level formed between the peaks.
-
Triple Bottom: The counterpart to the triple top, this pattern occurs after a downtrend and is characterized by three attempts to form a new low, with each failure resulting in a higher low. A breakout above the resistance line (neckline) suggests an upward price movement.
3. Indecision Patterns in Crypto Trading
Indecision patterns represent periods where the market lacks clear direction. These patterns typically occur during market consolidation phases, signaling uncertainty about the next price move.
3.1 Doji and Spinning Tops
-
Doji: A candlestick pattern that occurs when the opening and closing prices are nearly the same, signaling indecision in the market. Doji patterns are typically neutral but can act as signals for a reversal if they occur after a strong trend.
-
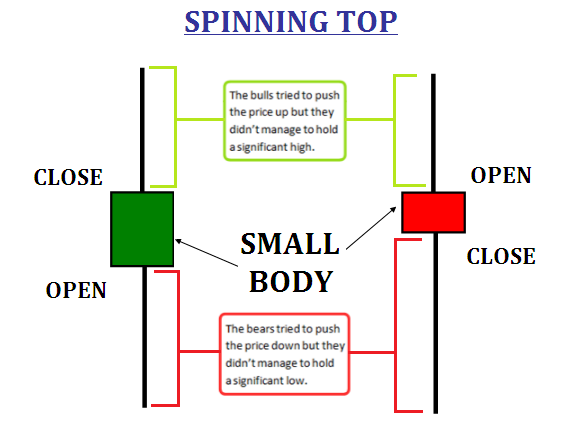
Spinning Top: A candlestick with a small body and long wicks on both sides. This pattern also indicates indecision in the market, suggesting that neither buyers nor sellers have control. It can precede a reversal or continuation, depending on the broader context.
3.2 Rectangle/Range-Bound Patterns
-
Rectangle: This occurs when the price trades between two horizontal support and resistance levels, creating a rectangular shape. It signals consolidation within a defined range, and when the price breaks out of this range, it often signals the next major move.
-
Range-Bound Market: When a cryptocurrency is stuck within a horizontal channel with no clear direction, it’s often due to a lack of strong buying or selling pressure. These patterns can lead to a breakout in either direction once sufficient volume enters the market.
4. Volume and Confirmation of Patterns
.png)
Volume plays a key role in confirming chart patterns in crypto trading. A pattern is generally more reliable when accompanied by increasing volume during the breakout, indicating strong market interest. Conversely, patterns that break with low volume can be less reliable and might fail to develop as expected.
-
High Volume: A breakout or breakdown accompanied by high volume increases the likelihood of the pattern being valid.
-
Low Volume: If a breakout occurs with low volume, the move may lack strength, and the price may reverse or consolidate.
5. Common Chart Patterns and Their Implications
.jpg)
To summarize, here’s a quick recap of some of the most significant chart patterns and their implications:
-
Flags, Pennants, Ascending Triangles
-
Signal that the price is likely to continue in the same direction (uptrend).
-
Bearish Continuation Patterns:
-
Descending Triangles, Bearish Flags
-
Indicate that the price will likely continue downward after a period of consolidation.
-
Bullish Reversal Patterns:
-
Double Bottom, Inverse Head and Shoulders, Triple Bottom
-
Suggest a reversal from a downtrend to an uptrend.
-
Bearish Reversal Patterns:
-
Double Top, Head and Shoulders, Triple Top
-
Indicate a reversal from an uptrend to a downtrend.
-
Indecision Patterns:
-
Doji, Spinning Top, Rectangle
-
Show that the market is uncertain and awaiting a breakout or breakdown.
Conclusion
Chart patterns are an essential tool for crypto traders. By learning to recognize these patterns and understanding their implications, traders can make informed decisions about entry and exit points. However, it's important to remember that chart patterns are not foolproof indicators. They should be used in conjunction with other forms of technical analysis, such as support and resistance levels, volume, and momentum indicators, to enhance accuracy and reduce risk.
Given the volatility of the cryptocurrency markets, it's crucial to practice effective risk management, including stop-loss orders, position sizing, and diversification, when trading based on chart patterns. As with any trading strategy, continuous education and experience are key to mastering chart patterns and making successful trades.
Read more:
.png)