English
 Tiếng Việt
1. What are Resistance and Support Levels?
In the context of technical analysis, including cryptocurrency analysis, "resistance" and "support" are crucial concepts used to forecast future price movements based on price charts.
-
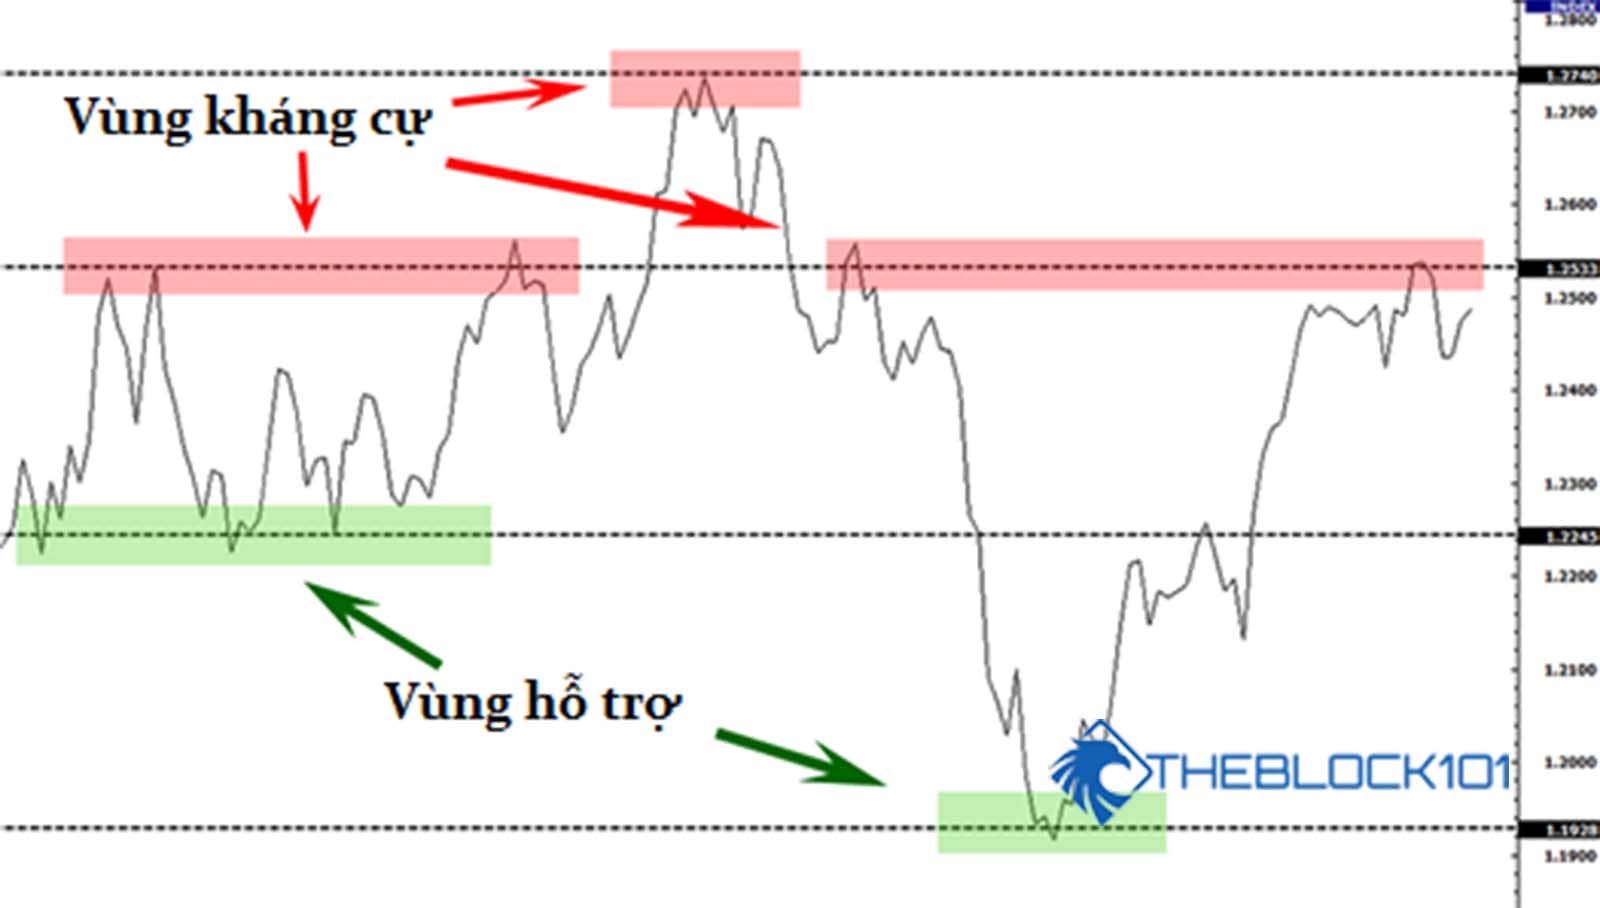
Resistance: Resistance refers to a price level or zone on a chart where the price faces difficulty in moving higher. This is often due to a high volume of sellers at that price, creating downward pressure and preventing the price from rising further. Resistance levels can be derived from previous price reversal points or technical indicators like moving averages and chart patterns.
-
Support: In technical analysis, support refers to a price level or zone on a chart where the price tends to stop declining and may bounce back. This typically occurs because of a high volume of buyers at that price, creating upward pressure and preventing the price from falling further. Support levels can also be based on previous price reversal points or technical indicators.
When applied to cryptocurrencies, technical analysis utilizes resistance and support levels to predict future price movements. Traders and investors can leverage information about these levels to make trading decisions, place buy or sell orders, or identify entry and exit points based on technical signals.
2. How to Identify Support and Resistance Levels in Crypto
Identifying support and resistance levels in the cryptocurrency market is a crucial aspect of technical analysis that helps traders understand price charts and predict future price movements. Here are the five most common methods to determine support and resistance levels:
- Examining Historical Price Charts: By analyzing historical price charts, traders can identify price levels where the price has previously struggled to break through or decline. Areas where the price has formed multiple peaks or troughs can indicate potential resistance or support levels.
- Using Moving Averages: Moving averages, such as the 50-day or 200-day moving average, are frequently used to identify support and resistance levels. When the price approaches a moving average, it may form a support level. Conversely, when the price crosses above a moving average, it may form a resistance level.
- Employing Chart Patterns: Chart patterns like triangles, cup and handle, head and shoulders, etc., can also help identify support and resistance zones. These patterns often emerge at specific price levels and can forecast potential price reversals.
- Utilizing Fibonacci Levels: Fibonacci levels (23.6%, 38.2%, 50%, 61.8%, 78.6%) are employed to determine support and resistance levels based on these percentage ratios. These levels are typically identified by selecting the high and low of a chart and applying the Fibonacci ratios to that range.
- Using Technical Indicators: Technical indicators like the Relative Strength Index (RSI), Moving Average Convergence Divergence (MACD), and Stochastic Oscillator can also provide insights into support and resistance levels.
It's essential to combine multiple methods when identifying support and resistance levels, rather than relying solely on one technique. Given the highly volatile nature of the cryptocurrency market, it's crucial to remain flexible and adapt to changing market conditions.
3. When Do Resistance and Support Levels Break?

Resistance and support levels can be breached when the cryptocurrency price moves beyond them and continues in that direction. This typically occurs due to shifts in market sentiment and the psychology of traders and investors. Here are some scenarios where resistance and support levels might break:
3.1. Breaking Resistance Levels
- Strong Price Increase: If the cryptocurrency price rises significantly and surpasses the resistance level, it could indicate a strengthening of buying pressure and the potential formation of a new uptrend.
- Increased Market Interest: Strong interest and participation from buyers can drive the price through resistance levels.
- Significant Events: Positive news about the project, new partnerships, or technology updates can propel the price above resistance levels.
3.2. Breaking Support Levels
- Sharp Price Decline: A significant drop in the cryptocurrency price and breaking below the support level can signal increasing selling pressure and the potential formation of a new downtrend.
- Market Concerns: Negative factors such as bad news about the project, security issues, or regulatory concerns can cause market participants to sell, driving the price down.
- Global Market Changes: Changes in the overall financial market or investor sentiment can influence the breaking of support levels.
However, it's important to note that a breach of resistance or support levels doesn't guarantee that the price will continue moving in the direction of the breakout. These levels can also reverse roles, meaning a former resistance level can become a new support level and vice versa. In the dynamic cryptocurrency market, monitoring both breakouts and shifts in market sentiment is crucial for making informed trading decisions.
4. The Significance of Resistance and Support Levels in Crypto
Like traditional financial markets, the cryptocurrency market heavily relies on resistance and support levels to shape price trends and inform trading decisions. These levels play a crucial role in:
- Predicting Price Trends: Resistance and support levels are key indicators for forecasting cryptocurrency price movements. When the price approaches a resistance level, it's likely to face downward pressure or stall. Conversely, when the price reaches a support level, it may rebound or find a floor. Identifying these levels accurately helps investors and traders understand price charts and market sentiment.
- Making Informed Trading Decisions: Understanding resistance and support levels empowers traders to make more informed buy or sell decisions. For instance, buying near a support level offers the opportunity to profit from a potential price increase, while selling near a resistance level can help mitigate losses