English
 Tiếng Việt
1. What is the Reversed Hammer Candlestick Pattern?
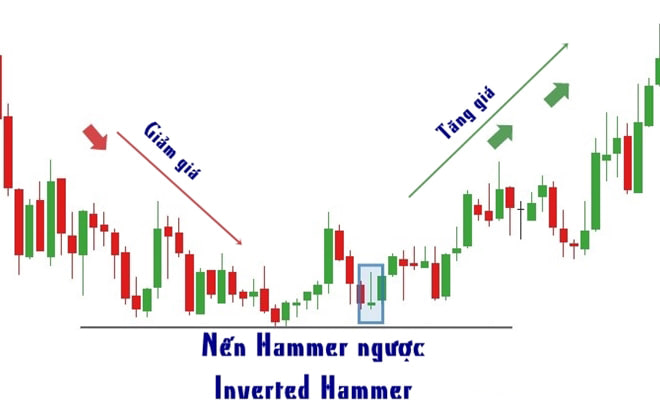
The reversed hammer (also called an inverted hammer) signals the end of a downtrend.
When you spot this pattern on a chart, it indicates buying pressure. As a result, the price may begin to rise. The reversed hammer warns traders that a bullish reversal pattern may be forming. A bullish reversal means that buyers will take control, reversing a downtrend into an uptrend.
Candlestick patterns represent the movement of prices on candlestick charts. These patterns help cryptocurrency traders try to predict the future direction of an asset's price. The reversed hammer is one such pattern on these charts.
The concept of candlestick charts was developed by a Japanese rice merchant named Munehisa Homma in the 18th century. Today, cryptocurrency traders use candlestick charts in their technical analysis to forecast what may happen next with the value of their assets.
2. Features of the Reversed Hammer Candlestick
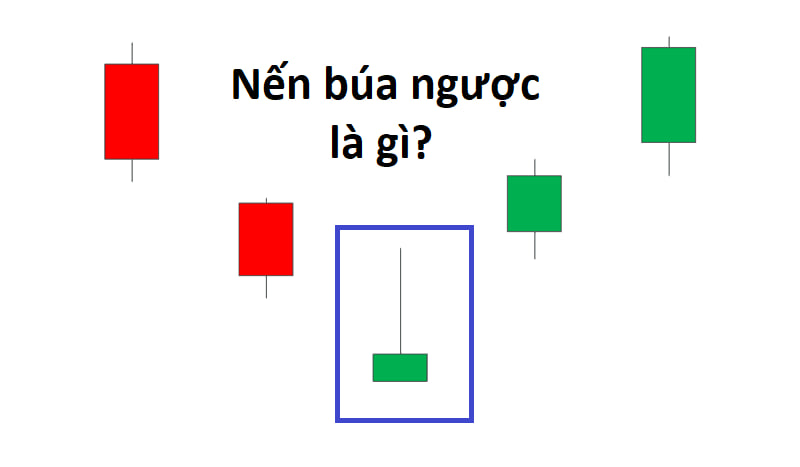
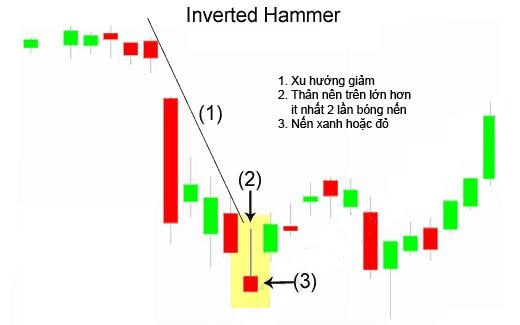
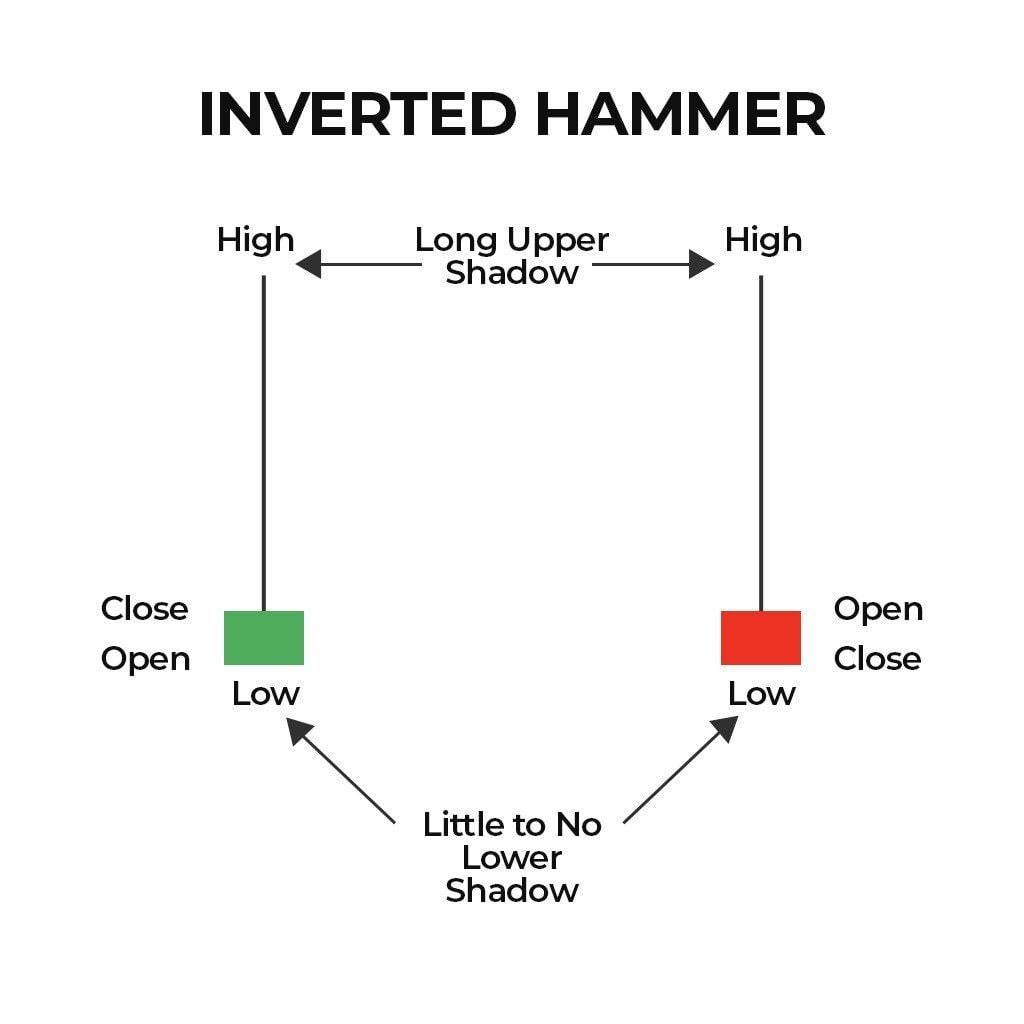
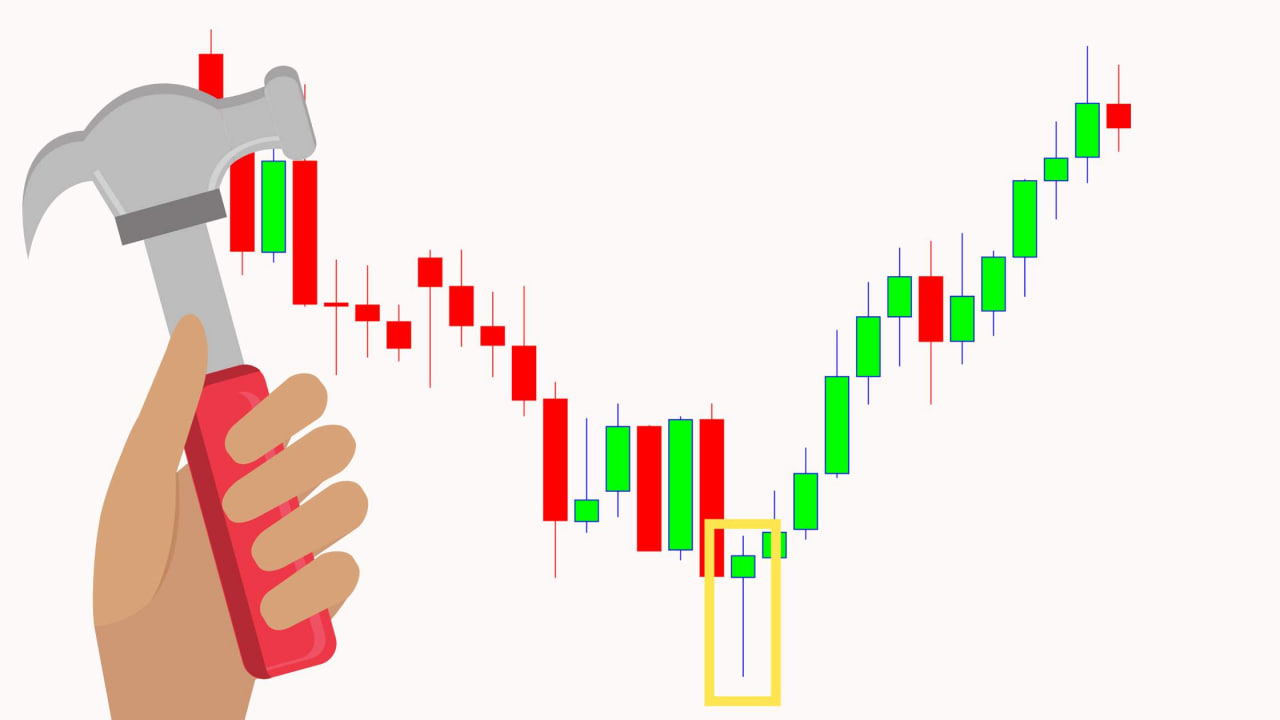
As the name suggests, the reversed hammer candlestick looks like an upside-down hammer or an upside-down "T". It has a short body with a long upper wick (also known as the shadow). It may or may not have a small lower wick. The upper wick is at least twice as long as the actual body.
Here's what the different parts of a candlestick mean:
- Body: Represents the price range from open to close.
- Wick: The wick (or shadow) represents the highest and lowest prices during the day.
- Color: The color of the candlestick body indicates the direction of the asset's price movement. A white or green body suggests a price increase, while a black or red body indicates a price decrease.
The reversed hammer can be either green (bullish) or red (bearish).
- Green Reversed Hammer (Bullish): Formed when the closing price is higher than the opening price and has a long upper wick.
- Red Reversed Hammer (Bearish): Formed when the closing price is lower than the opening price and also has a long upper wick.
In both cases, the opening and closing prices will be very close to each other, contributing to the hammer shape. The green reversed hammer is considered a more positive indicator than the red one, though both are generally seen as bullish signals.
3. How Does the Reversed Hammer Candlestick Form?
The reversed hammer forms when traders are optimistic, and the opening price is the lowest, with the closing price being very close to the opening price. Optimistic traders create the long upper wick when they dominate the market and push the price up as high as possible. On the other hand, short-sellers create a small lower wick when they oppose the price increase, trying to push it back down to the opening price. However, with the reversed hammer candlestick appearing, buying pressure outweighs selling, and the price will end higher.
Thus, the reversed hammer is interpreted as an optimistic signal. The price resists the downtrend due to strong buying pressure from buyers. The next day's candlestick is considered a follow-up signal for traders to assess whether the price may continue to rise or possibly start to fall again.
The reversed hammer can also appear during an uptrend. When this happens, it serves as a warning to traders of a potential upcoming reversal. It forms when the opening price, the lowest price, and the closing price are all nearly identical.
Details of Reversed Hammer Formation
A bullish reversed hammer formation consists of two candlesticks: a tall black or red candlestick followed by a short candlestick with a long upper wick. The tall candlestick appears on the first day, and the short candlestick appears on the second day. Both candlesticks appear at the end of the trading range.
- The market opens at the end of the trading range when the reversed hammer candlestick forms.
- Buyers attempt to reverse the downtrend, but the price rise is not strong enough due to pressure from sellers. As a result, the asset's price closes close to its opening price.
- Confirmation of the reversal can only be more confidently assessed on the second day (however, keep in mind that nothing is certain in the market). At this point, the opening price is higher than the body of the reversed hammer. This confirmation becomes more reliable when the market opens at a higher price.
In summary, the reversed hammer is a useful tool for identifying potential trend reversals. While it is a bullish pattern, the context and confirmation in subsequent candlesticks are crucial for making accurate predictions in cryptocurrency trading.
4. The Meaning of the Inverted Hammer Candle
After a prolonged downtrend, the Inverted Hammer candle appears, signaling an increase in buying pressure. It warns traders that a potential reversal to an uptrend may occur. The short body of the candle suggests that the asset's price has fallen, and the sellers have lost control.
However, traders should not rely solely on the Inverted Hammer candle. They need to observe other candle characteristics, technical indicators, and the following candle patterns to make informed decisions. For example, a long upper shadow is a strong indicator of a potential bullish reversal. Additionally, a green Inverted Hammer candle suggests an uptrend.
Therefore, depending on what other indicators and the next candles reveal, consider buying only if you believe the uptrend will continue. Conversely, you should sell if you believe the Inverted Hammer candle is not strong enough and the downtrend is likely to persist.
5. Advantages and Disadvantages of the Inverted Hammer Candle
5.1 Advantages
-
Easy to Identify: The Inverted Hammer candle is easily identifiable because it appears at the end of a trading range and has a characteristic shape resembling an upside-down hammer. This makes it beginner-friendly.
-
Opportunities to Trade at Multiple Points: The Inverted Hammer candle allows traders to take positions at the start of an uptrend or when the uptrend is in the accumulation phase.
5.2 Disadvantages
-
Can Be a Short-Term Indicator: The Inverted Hammer candle may only indicate a short-term reversal and not a sign of a long-term trend. Therefore, confirming the market direction before making any moves is essential.
-
Requires Additional Indicators: Traders should not rely solely on the Inverted Hammer pattern. They need to consider other indicators to make the best decision.
6. How to Trade Effectively with the Inverted Hammer Candle
6.1 Trading with Support Zones
The Inverted Hammer candle tends to be more effective when it appears at strong support levels, where the risk in trading is reduced. It is crucial for traders to be patient and wait for the right moment to enter a trade, rather than acting impulsively based on weak signals.
When the market is in a downtrend and approaching a support level, if an Inverted Hammer candle appears, traders can take the following steps:
- Buy if the next candle is bullish.
- Set the stop-loss just below the support level.
- Take profit near the resistance level, ensuring a reasonable risk/reward ratio.
6.2 Trading with Fibonacci Retracement Levels
Fibonacci retracement levels are a reliable tool when combined with the Inverted Hammer candle to gain an advantage in trading.
Steps to execute:
- Ensure the Inverted Hammer appears in a downtrend.
- Draw the Fibonacci retracement from the high to the low of the previous uptrend.
- Place a buy limit order near the top of the Inverted Hammer candle, around 1-2 pips away.
- Set the stop-loss just below the bottom of the pattern, a few pips below the low.
- Set the take-profit target at strong resistance levels or near the stop-loss, ensuring the potential reward matches the risk.
7. Important Notes for Investors Using the Inverted Hammer Candle
The Inverted Hammer is a pattern that cryptocurrency traders can use to enter, exit, or place positions. It is relatively easy to understand, making it suitable for beginners. However, it is necessary to make trading decisions based on a combination of factors and trading signals. This includes emotional factors, technical analysis, and chart patterns. You should not base your decisions solely on the Inverted Hammer candle; it is one of many tools to perform effective market analysis.
If you want to improve your skills and gain deeper insights into trading, platforms like TradingView offer smart drawing tools and features that help you use charts and perform technical analysis effectively.
8. Frequently Asked Questions (FAQs)
Q1: What is the difference between the Inverted Hammer and the regular Hammer candle?
The Inverted Hammer has a long upper shadow and a short lower shadow, while the regular Hammer has a long lower shadow and a very short or non-existent upper shadow. Both are reversal patterns, but their shapes differ.
Q2: When is the Inverted Hammer not reliable?
The Inverted Hammer may not be reliable when it appears alone without supporting factors such as strong support zones, high trading volume, or confirmation from other technical tools. Trading based solely on the Inverted Hammer without confirmation can lead to false signals.
Q3: What is the ideal entry point for the Inverted Hammer?
Traders often enter a buy position immediately after the next candle is bullish (green), and they can set a stop-loss below the bottom of the Inverted Hammer to minimize risk.
Q4: How can I optimize profits when trading with the Inverted Hammer?
To optimize profits, traders should take profit near the nearest resistance levels or use a suitable risk/reward ratio, such as 1:2 or 1:3, depending on the time frame and market conditions.
9. Conclusion
Mastering the reading of this pattern is an important step for newcomers in the financial markets. It is important to remember that, like any technical analysis tool, the Inverted Hammer candle does not guarantee specific outcomes. Traders need to continuously enhance their skills, monitor market trends, and apply their knowledge flexibly. Learning and practicing the Inverted Hammer pattern will help build a solid foundation for making investment decisions in the complex world of financial markets.
Read more: