English
 Tiếng Việt
1. Resistance level, support level
Resistance is a straight line connecting peaks on a price chart, acting as a price barrier. When the price meets the resistance line, it often tends to bounce back due to selling pressure from bears.
Support, on the other hand, is a straight line connecting troughs on a price chart, serving as a price floor. When the price approaches the support line, it tends to be pushed back up.
However, these terms are described as "often" because there's no exact definition for a strong resistance or support line. Prices can approach a resistance level multiple times without necessarily being rejected after 4-5 attempts, making it more like a wall that becomes easier to break through with each attempt. Sometimes, prices touch a level several times and then reverse upward again. This shows that support and resistance lines are relative concepts; there are no hard resistance or support lines.
There are two common types of support and resistance lines: horizontal and diagonal. Another type is dynamic support and resistance, which includes Moving Averages (MA), EMA, SMA, etc. I won't discuss dynamic support and resistance here as I have a separate article on that topic.
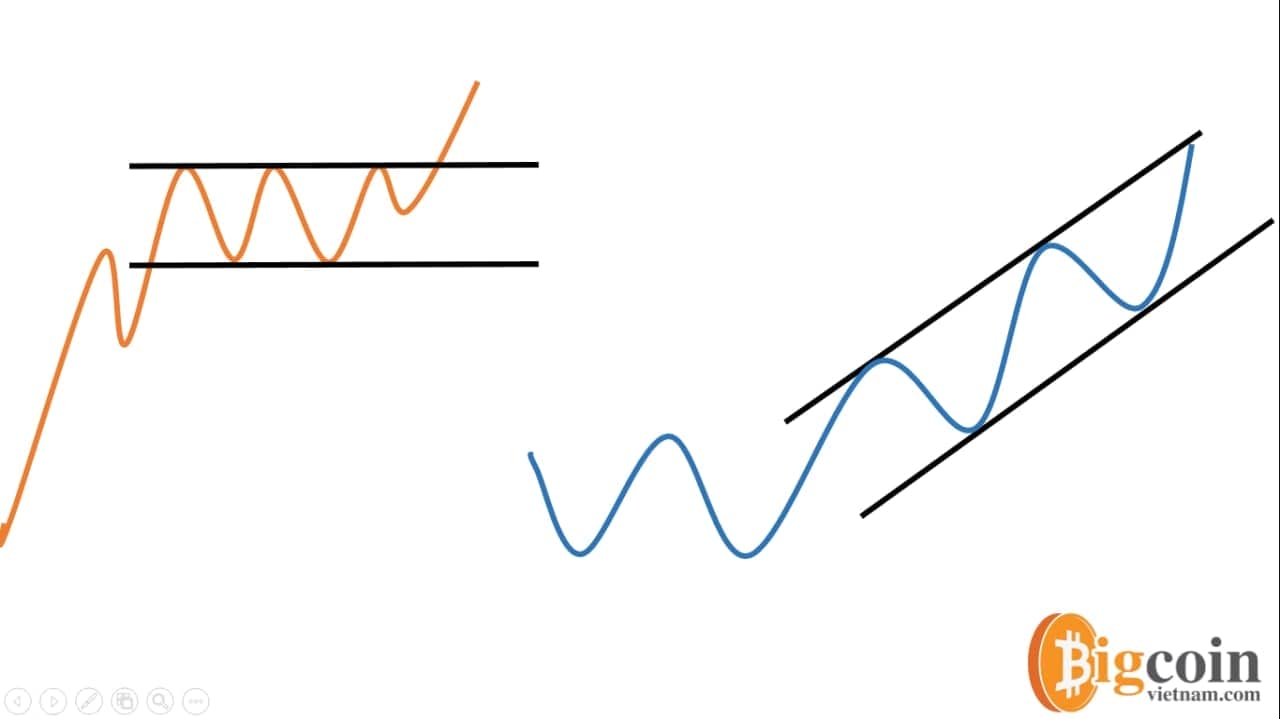
With support and resistance lines, we can easily identify market trends. When plotting a support line through lows and it trends upwards, it indicates an upward trend. However, it's important to note that a broken resistance or support line doesn't necessarily mean the trend is broken.
The market often shows long candle wicks, making the drawing of support and resistance lines highly subjective. Three people looking at the same chart may draw them differently. The key is to make it as logical as possible, with more touches of highs and lows adding to its reliability.
So, when the price approaches a support or resistance line, how should we trade?
2. Guide to Trading with Support and Resistance Lines
Many traders make mistakes regarding support and resistance by entering trades as soon as the price touches these levels. In reality, touching support does not guarantee a bounce back, as I mentioned earlier. Therefore, to trade effectively and profitably with support, you must understand candlestick patterns.
Let's take an example: Whenever the price touches a support line and a candlestick pattern like bullish engulfing, hammer, or harami appears, you can open a trade and set a stop loss according to the candlestick pattern. Similarly, with resistance lines, if the price touches resistance and a bearish engulfing, shooting star, or hanging man candlestick pattern appears, that's when you should consider entering a trade.

For example, let's say we've identified a support line like this. On the third touch of this support line, a bullish engulfing candlestick pattern appears. This is the opportune moment to enter a buy trade. If we take profit early near the resistance level above, we can still secure a small profit. If you're unfamiliar with candlestick trading, I recommend revisiting articles on candlesticks to learn more.
Read more:
.jpg)