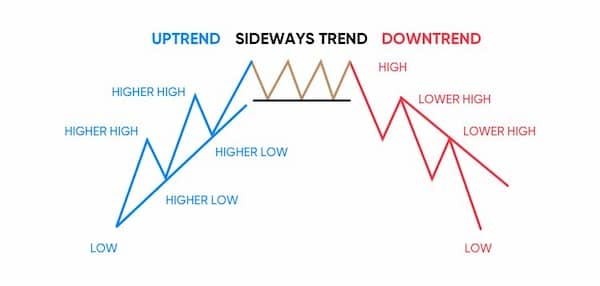
1. What are market trends?

The market trend of Bitcoin can be understood as the direction in which Bitcoin's price moves over a specific period. Market trends are typically analyzed in long-term, short-term, and medium-term time frames.
2. How many types of market trends

There are three main market trends:
- Uptrend
- Sideways
- Downtrend
A classic question I frequently encounter, especially during periods of significant market fluctuations, is: "What is the upcoming trend for Bitcoin?" or, for example: "Will the uptrend or downtrend continue?"
This is not a difficult question, and now I'll help you understand how to identify market trends!
2.1. Uptrend
In an uptrend, regardless of the time frame you are looking at, it must meet the following criteria:
- Each peak must be higher than the previous peak.
- Each trough must be higher than the previous trough.
- Each subsequent trough must be either higher than or, in some cases, the same as the previous trough, but it should never be lower than the previous trough. If a subsequent trough falls below the previous one, we need to reconsider and reassess the trend.
2.2. Downtrend
In a downtrend, the conditions are the opposite:
- Each peak must be lower than the previous peak.
- Each trough must be lower than the previous trough.
- In some cases, the price chart may show a retracement with two equal peaks, but if the subsequent trough is still lower, the trend has not yet reversed. A trend reversal is only confirmed when the price chart forms a peak that is higher than the previous peak. At this point, the price chart will aim to create a subsequent trough that is higher than the previous one to confirm the trend reversal.
2.3. Sideway
-
In a sideways trend, the price chart moves within a specific range. Peaks and troughs are not clearly defined, and in some cases, subsequent peaks and troughs may continually be lower than the previous ones, forming a pattern known as a Flag or Pennant.
-
A sideways trend is often the most frustrating for traders, though it can also present opportunities for professional traders. Since the price only moves within a set range, it doesn’t provide a large profit margin for traders. However, for margin traders, a sideways trend is a prime time for trading opportunities. The continuous price movements create frequent day trading opportunities, and the support and resistance levels during this phase can become quite strong, providing excellent entry points. On the downside, this phase can also result in many wicks on candles, potentially triggering stop-loss orders. Thus, it can be either a chance or a risk that could deplete a trader's account.
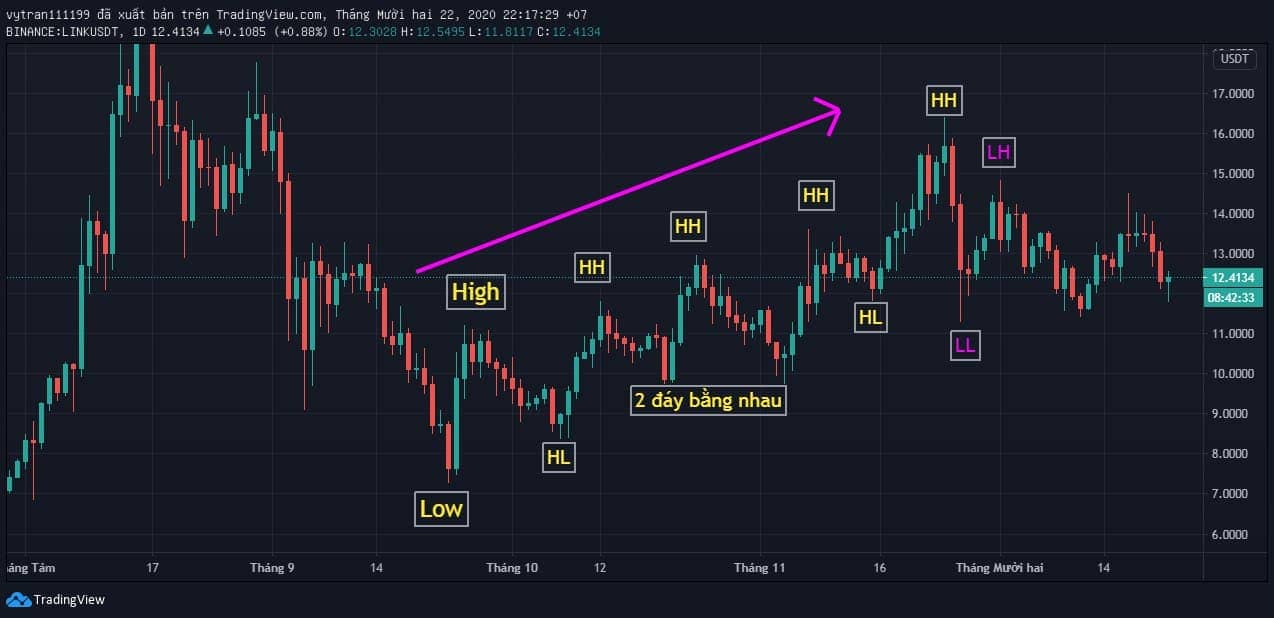
Now, let's look at the daily chart of LINK/USDT to examine an example of an uptrend.

And that was just an overview of how to identify market trends using candlestick patterns. There are many other methods for determining trends, such as using moving averages (MA) or indicators like the MACD. I will cover these in more detail in dedicated articles for each indicator. However, regardless of the method, identifying market trends using candlestick structures remains the most effective and quickest approach.
Read more:

 English
 Tiếng Việt
.jpg)


