1. How is the Flag pattern formed?
After strong uptrends or downtrends, price charts often experience consolidation phases where the price moves sideways and within a narrow range. This is also when price patterns are formed.
To identify a Flag pattern, you need to draw a resistance line through the peaks and a support line through the troughs during this phase. This will form a triangle shape. The triangle represents the flag, while the preceding trend is the flagpole.
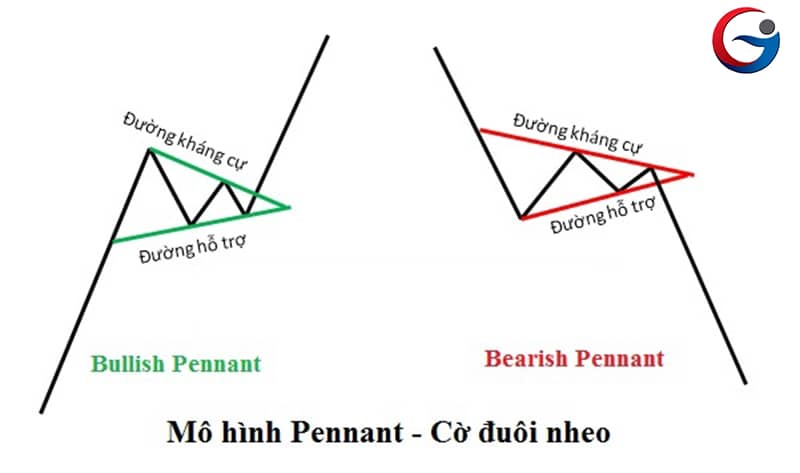
This is a consolidation phase in the price chart, if the price breaks out above or below the flag, it will lead to a new trend. It is commonly mistaken that a bullish flag pattern will continue the previous uptrend, and similarly, a bearish flag pattern will continue the downtrend. While you often hear about bullish and bearish flags, will they actually continue the current market trend?
My answer is "No." A bullish flag can reverse the trend from up to down, and a bearish flag can reverse from down to up. If a bullish flag appears during an uptrend, the probability of continuing the uptrend is 70%, with a 30% chance of a reversal. A 30% chance is significant enough for an unforeseen event to occur. The essence of the flag pattern is simply a phase where the price consolidates before continuing to rise or fall. Nothing is certain until the price breaks out of the flag pattern.
2. Market Trend
I will show you two examples: one where a bullish flag appears during an uptrend but the price falls, and another where a bearish flag appears during a downtrend but the price rises. In these cases, the flag pattern does not continue the previous trend but instead reverses it.

In the first example, the prior trend was up, and the price entered a consolidation phase forming a bullish flag. Theoretically, the price should continue the previous uptrend. However, the price then broke down and decreased.

In the second example, the prior trend was down, and the price formed a bearish flag. But immediately after breaking out, the price reversed and increased.
So how do you trade using the Flag pattern?
Before trading, you need to identify the Flag pattern. To do this, you should draw resistance and support lines. At least the top and bottom edges of the triangle should pass through at least two peaks and two troughs. During these consolidation phases, there is also a high risk of stop-losses being triggered. False breakouts are common with flag patterns.

To determine if a breakout is genuine, pay attention to the trading volume during the breakout phase. Some breakouts are real but occur with low volume. However, if the volume confirms the breakout, the signal will be much stronger.
You should avoid trading while the pattern is forming because this phase is highly risky due to potential false breakouts and uncertainty about whether the trend will continue as theory suggests.
We should only place a trade when the price breaks out of the flag pattern and successfully backtests. Set a stop-loss if the price breaks below the nearest trough and take profit according to the flagpole. You can draw a parallel line to the flagpole and place it at the breakout point to determine the profit-taking level.
Currently, on the H4 chart of Bitcoin, this flag pattern is appearing. At this moment, we cannot say whether it will continue the previous uptrend. We need to wait and see which direction Bitcoin will break out before we can trade.
Read More:
- A Beginner’s Guide To Reversal Candle Patterns
- What is a Spinning Top Candle? Analyzing Market Neutrality
- How to make money from Hammer Candles?

 English
 Tiếng Việt
