1. What is a candlestick?

A candlestick is a visual representation of price movement over a specific time period. Each candlestick typically shows four key price points: the opening price, the closing price, the highest price, and the lowest price during that time period. When viewed collectively, candlesticks help traders assess market trends, momentum, and potential price reversals.
Candlesticks can be used on any time scale, from minutes to days or even months, depending on the trading strategy and analysis being performed. They are primarily used in technical analysis, allowing traders to make decisions based on past price movements.
2. The components of a candlestick

Each candlestick is made up of several key parts, each of which provides essential information about the market's activity during a specific period. Here's a breakdown of the anatomy:
-
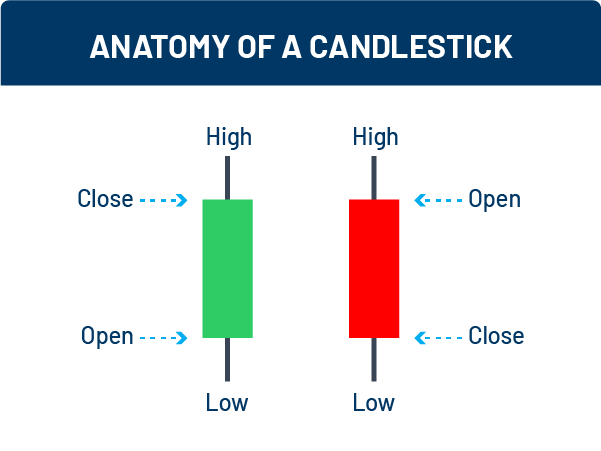
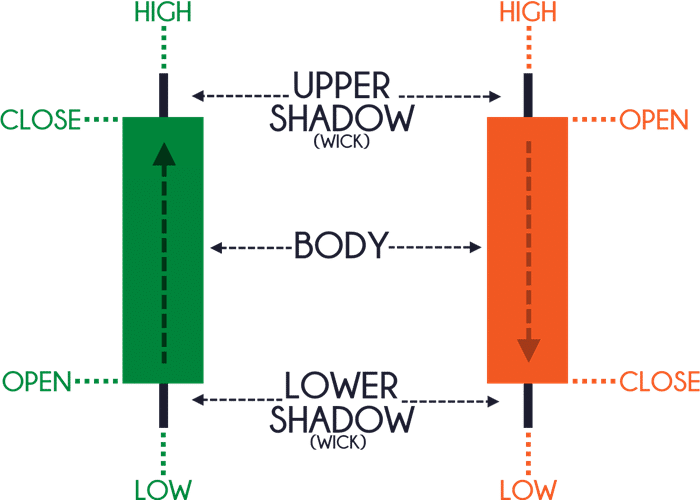
Body: The body of the candlestick represents the range between the open and close prices during the given time period.
-
If the close price is higher than the open price, the candlestick body is typically filled with a light color (often white or green), signifying a bullish (upward) market.
-
If the close price is lower than the open price, the candlestick body is typically filled with a dark color (often black or red), signifying a bearish (downward) market.
-
Wicks (or Shadows): The wicks are the thin lines extending above and below the body of the candlestick. These lines represent the highest and lowest prices reached during the time period.
-
Upper wick (or upper shadow): This is the line extending from the top of the body to the highest price reached during the period.
-
Lower wick (or lower shadow): This is the line extending from the bottom of the body to the lowest price reached during the period.
-
Open: The opening price is the first price traded at the beginning of the time period. It is indicated by the bottom of the body in a bullish candlestick or the top of the body in a bearish candlestick.
-
Close: The closing price is the last price traded at the end of the time period. It is indicated by the top of the body in a bullish candlestick or the bottom of the body in a bearish candlestick.
3. Types of candlesticks
.png)
Candlesticks can be classified into various types based on their shape and color. The most common types of candlesticks traders use include:
-
Bullish Candlestick: A bullish candlestick occurs when the close price is higher than the open price. This typically indicates that the market is in an upward trend. The body will usually be filled with a light color (green or white).
-
Bearish Candlestick: A bearish candlestick occurs when the close price is lower than the open price. This signals that the market is in a downward trend. The body is typically filled with a dark color (red or black).
-
Doji: A doji candlestick occurs when the open and close prices are nearly identical, forming a very small body. The long wicks indicate a market that has a lot of indecision, with neither the bulls nor bears taking full control. A doji can signal a potential reversal or continuation, depending on the context.
-
Hammer and Hanging Man: These candlesticks have a small body at the top of the candle with a long lower wick. A hammer (bullish reversal) occurs after a downtrend, while a hanging man (bearish reversal) occurs after an uptrend.
-
Engulfing Patterns: An engulfing candlestick pattern consists of two candles. A bullish engulfing pattern occurs when a small bearish candlestick is followed by a large bullish candlestick that completely engulfs the previous one. A bearish engulfing pattern happens when a small bullish candlestick is followed by a large bearish candlestick that engulfs the previous one. These patterns are often seen as strong reversal signals.
4. Reading candlestick charts

Traders use candlestick patterns to make decisions about when to enter or exit a trade. By interpreting the shapes, sizes, and positions of the candlesticks on a chart, traders can gain insights into market sentiment and potential future price movements. Some common techniques for reading candlestick charts include:
-
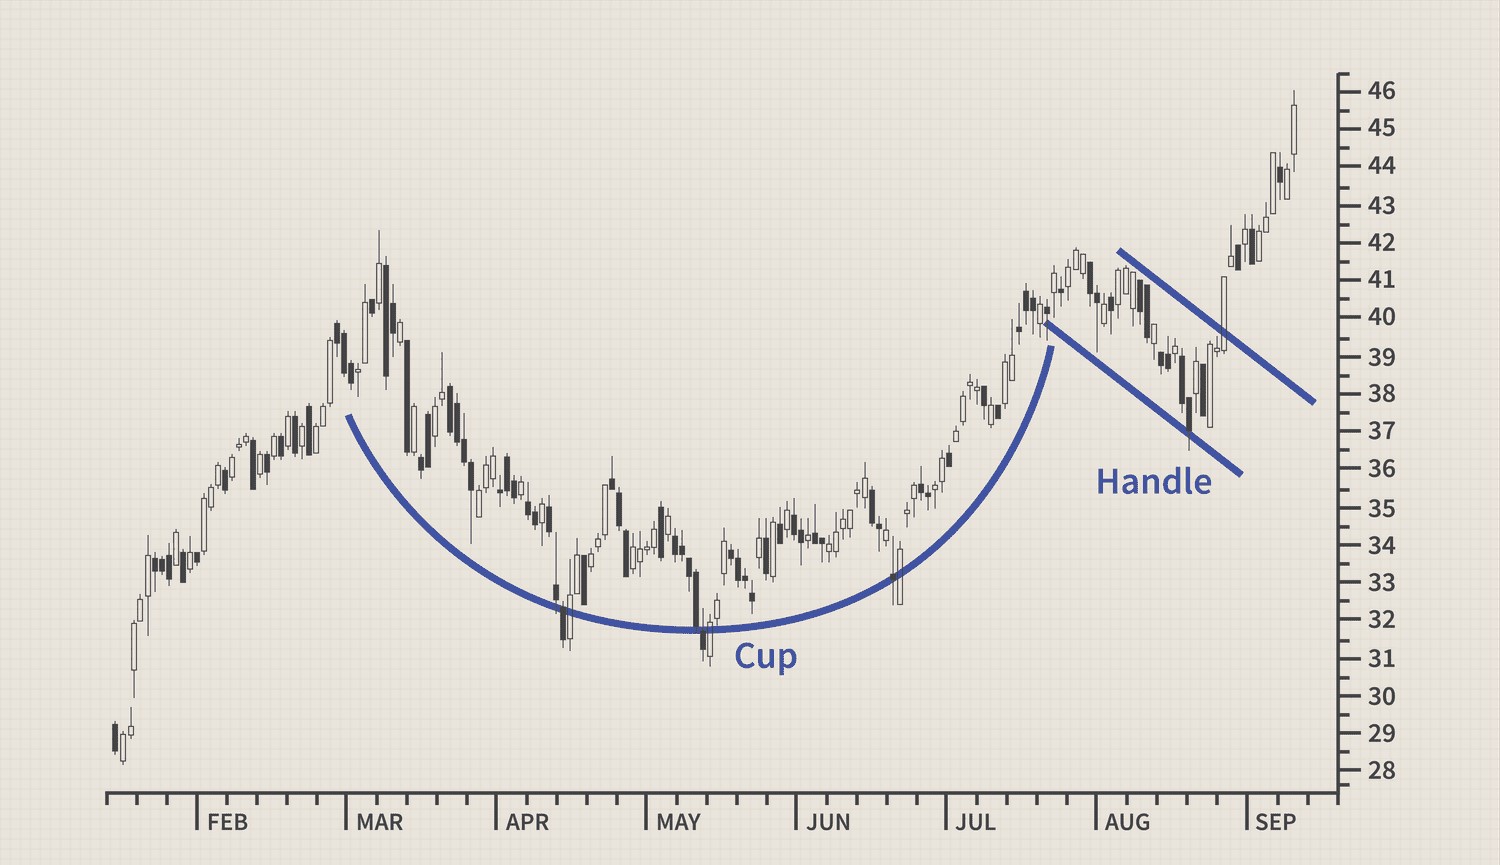
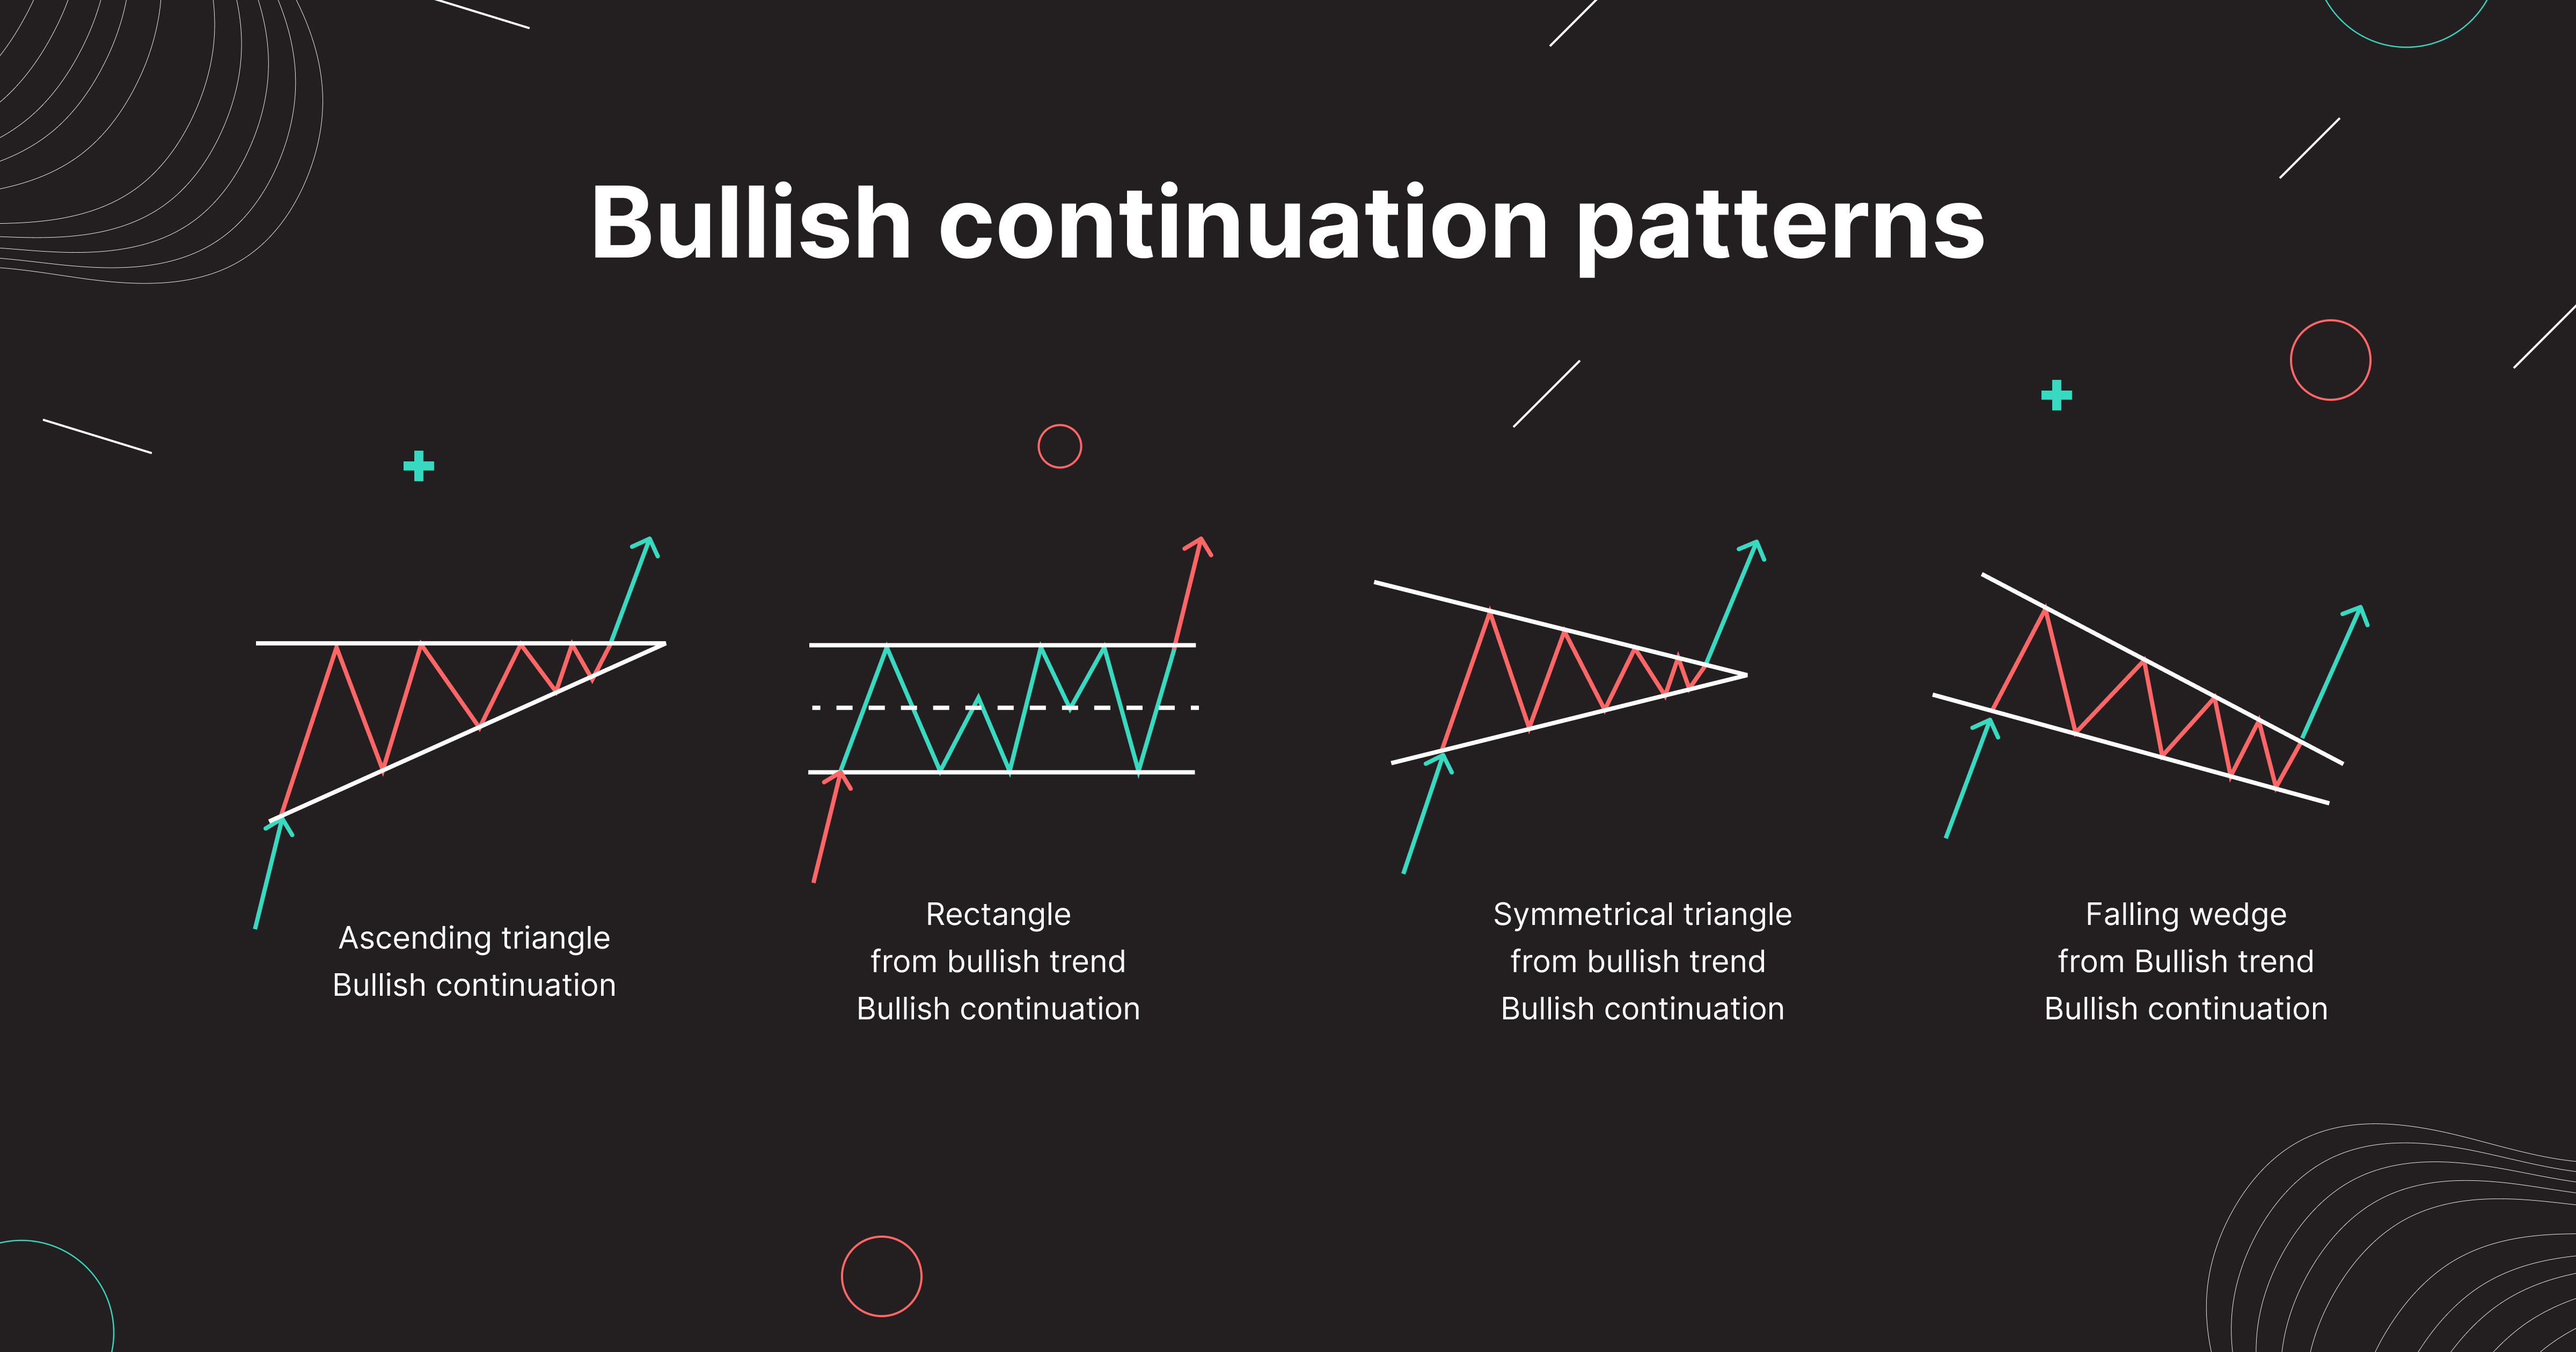
Trend identification: By observing a series of candlesticks, traders can identify whether the market is trending upward (bullish), downward (bearish), or moving sideways (neutral).
-
Reversal signals: Candlestick patterns such as doji, hammer, and engulfing patterns are often used by traders to identify potential reversals in price direction. For example, a bullish engulfing pattern after a downtrend might indicate that the market is about to reverse and move upward.
-
Support and resistance: Traders look for candlesticks that touch or break certain price levels to identify support (a price level where the asset tends to find buying interest) or resistance (a price level where the asset tends to face selling pressure).
5. Candlestick patterns for trading

Some candlestick patterns are used by traders as part of a trading strategy to predict future price movements. A few key patterns include:
-
Morning Star: A three-candle pattern that signals a bullish reversal. The first candle is bearish, followed by a doji or small candle, and then a large bullish candle.
-
Evening Star: A three-candle pattern that signals a bearish reversal. The first candle is bullish, followed by a doji or small candle, and then a large bearish candle.
-
Bullish and Bearish Engulfing: These patterns consist of two candles. A bullish engulfing pattern occurs when a small bearish candle is followed by a larger bullish one, indicating upward momentum. A bearish engulfing pattern occurs when a small bullish candle is followed by a larger bearish one, indicating downward momentum.
-
Shooting Star: A candlestick pattern that resembles an inverted hammer. It typically occurs after an uptrend and signals a potential reversal to the downside.
6. Conclusion
Understanding the anatomy of a candlestick is essential for any trader using technical analysis. Candlesticks provide valuable insights into market sentiment and price action, which can be used to identify trends, reversals, and key support and resistance levels. By learning how to read and interpret candlestick charts, traders can make more informed decisions and improve their trading strategies.
Read more:

 English
 Tiếng Việt
.png)
.jpg)

.jpg)
.jpg)
.jpg)

.jpg)
.jpg)

.jpg)
.jpg)
.jpg)


