English
 Tiếng Việt
1. What is the Cup and Handle Pattern?
.jpg)
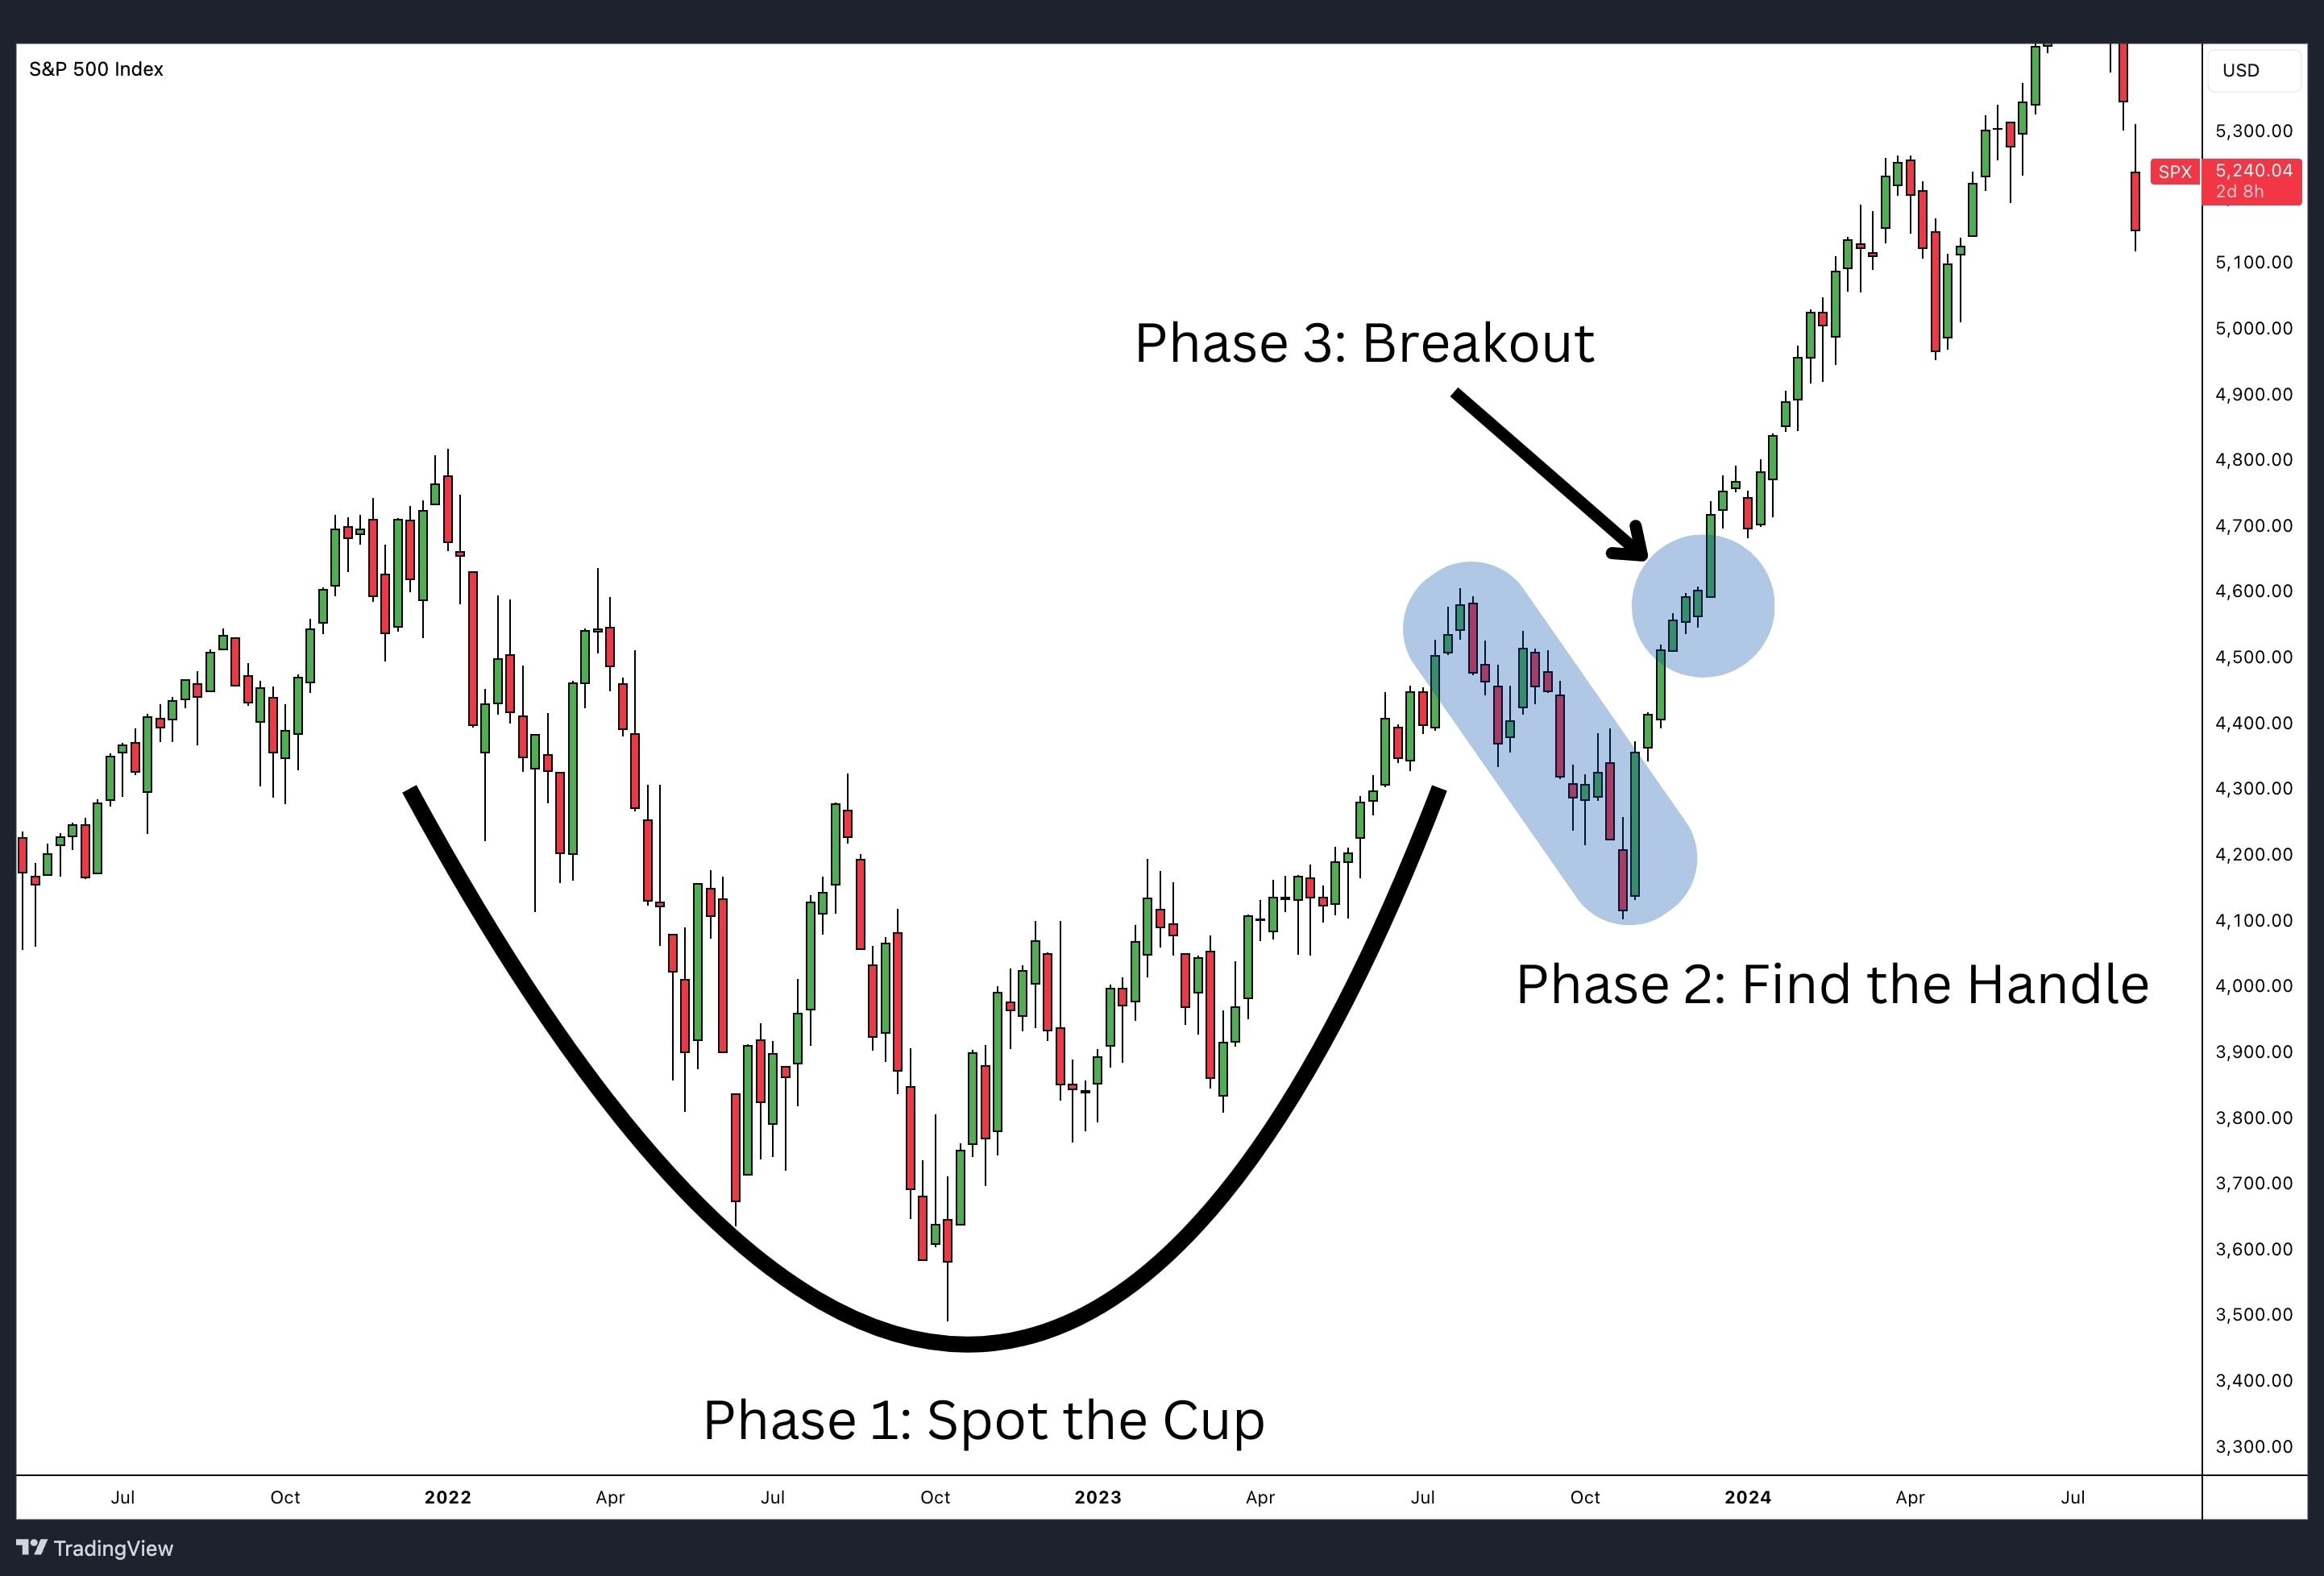
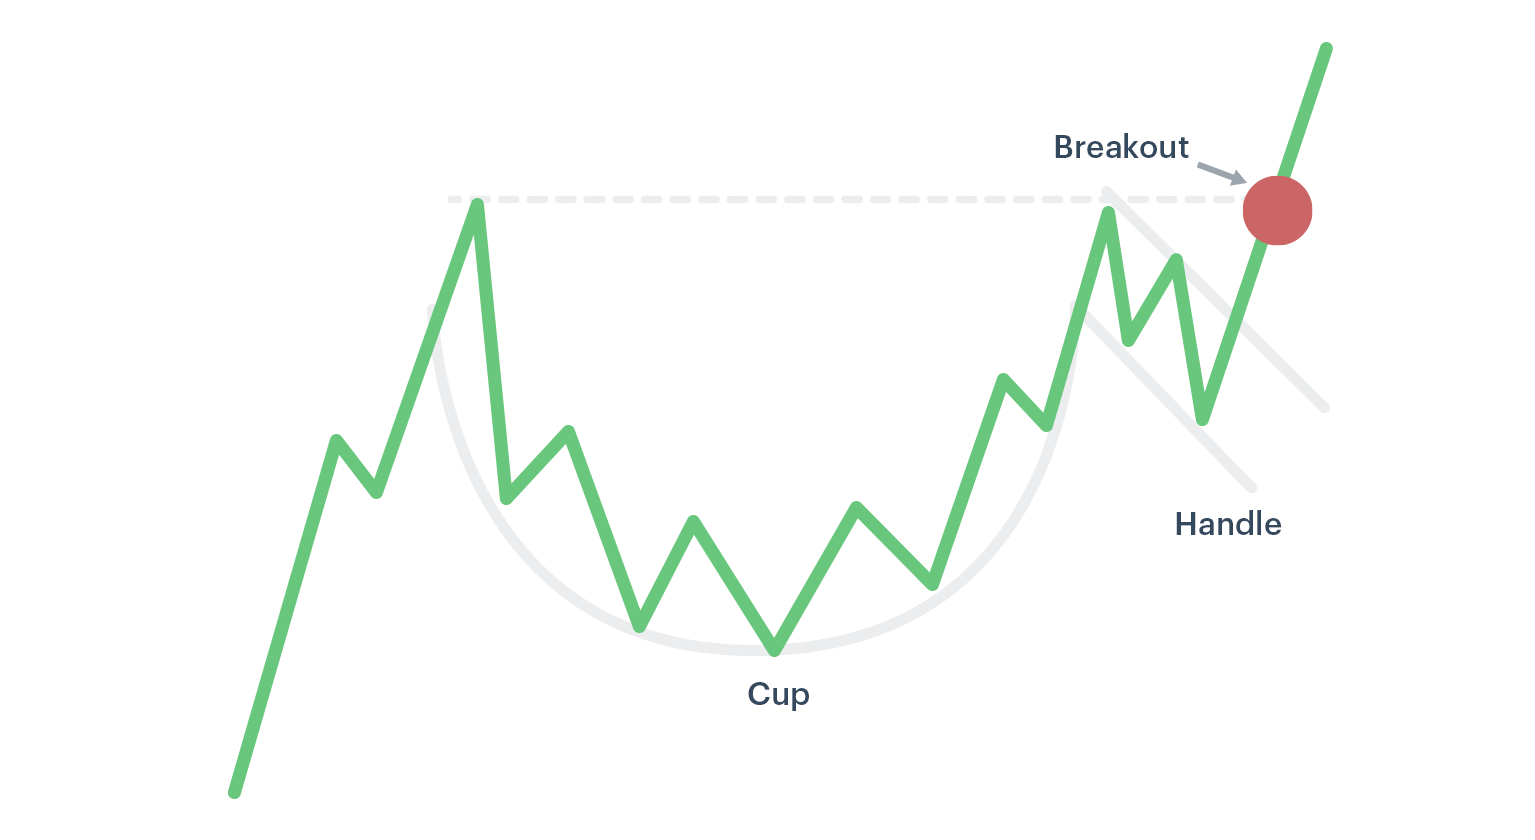
The Cup and Handle pattern is a technical chart formation that resembles the shape of a tea cup, with two distinct parts: the "cup" and the "handle." This pattern typically appears after a downtrend or a period of consolidation and signals a potential reversal and a strong move upwards.
-
Cup: The cup is the rounded, U-shaped portion of the pattern, which represents a period of consolidation. During this phase, the asset's price falls, stabilizes at a lower level, and then begins to rise again.
-
Handle: The handle is the small downward consolidation that forms after the cup. It represents a brief period of profit-taking or minor selling pressure before the price breaks out again. The handle typically forms just below the cup's peak.
Once the price breaks above the resistance formed by the cup’s high, this is considered a confirmation that the bullish trend is beginning, and traders often enter the market at this point.
2. Why does the Cup and Handle Pattern work?
.png)
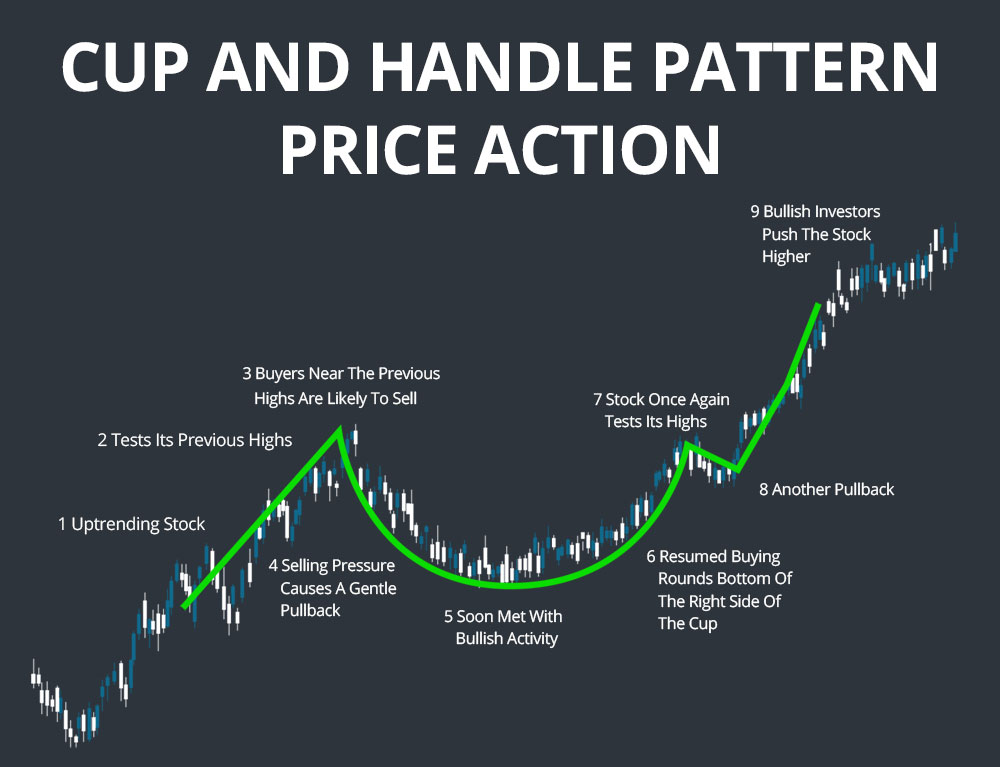
The Cup and Handle pattern is effective because it reflects the psychological shift in the market. The cup represents a period of accumulation, where selling pressure has dissipated, and the asset stabilizes at a lower level. The handle portion shows that there is some resistance, but the demand for the asset continues to grow, and eventually, the price breaks out to the upside.
This pattern is often seen as a sign that the asset has transitioned from a bearish or neutral market to a bullish one. It indicates that buyers have gained enough confidence to push prices higher, and the breakout signifies the beginning of a new upward trend.
3. How to Trade the Cup and Handle Pattern
Trading the Cup and Handle pattern involves careful observation and patience. The process is straightforward, but it requires traders to wait for the right conditions to confirm the pattern. Here's how to approach it:
3.1. Identify the Cup Formation
The first step in trading the Cup and Handle pattern is recognizing the formation of the cup. This typically takes time, often ranging from weeks to months, depending on the timeframe of the chart. The price will create a rounded bottom, signaling that sellers have exhausted themselves and buyers are starting to take control.
3.2. Wait for the Handle to Form
The handle portion should be formed after the price begins to move upward from the cup. It typically involves a small pullback, often in the form of a consolidation or a minor dip, and should be more shallow than the cup. The handle must form below the level of the cup's peak, but it should not dip back into the lower half of the cup.
3.3. Look for the Breakout
Once the handle is formed, watch for a breakout above the resistance level that was created by the top of the cup. This breakout is the key signal to enter a long position. Ideally, the breakout should be accompanied by increased volume, confirming that the price movement is supported by strong buying interest.
3.4. Set Targets and Stop-Loss
After entering a trade based on the Cup and Handle breakout, it’s important to set both a profit target and a stop-loss.
-
Profit Target: A common method to estimate the price target after the breakout is to measure the height of the cup (from the bottom of the cup to the top) and project that distance upward from the breakout point.
-
Stop-Loss: To manage risk, a stop-loss order is often placed just below the handle’s lowest point. This way, if the price fails to maintain the breakout and reverses, the trader’s position is protected.
4. Real-World Example of the Cup and Handle in Crypto
Let’s consider a hypothetical example in the cryptocurrency market:
Imagine Bitcoin is in a long downtrend, falling from a high of $65,000 to around $30,000. Over several months, the price begins to consolidate, forming the “cup” shape. The price then begins to rise again, reaching a high of $50,000, before entering a brief consolidation period (the handle) just below the $50,000 resistance level. Eventually, the price breaks above $50,000 with significant volume, signaling the breakout, and traders begin entering long positions in anticipation of further gains.
If the pattern is validated, Bitcoin could potentially reach a new high, forming a bullish trend that might last for weeks or even months.
5. Common pitfalls to avoid
While the Cup and Handle pattern is a reliable bullish formation, it is not without risks. Traders should be aware of certain pitfalls that can lead to losses or missed opportunities:
-
False Breakouts: Not all Cup and Handle patterns lead to successful breakouts. A false breakout occurs when the price briefly moves above the cup’s peak but fails to maintain momentum, resulting in a price pullback. Traders should always ensure that there is significant volume accompanying the breakout to confirm its validity.
-
Handle Formation Issues: If the handle drops too far below the cup's high, it could be a sign that the pattern is weakening or failing. A shallow handle is typically preferred, and a deep or volatile handle might suggest a less reliable pattern.
-
Volume Confirmation: Volume is a critical aspect of the Cup and Handle pattern. The breakout must be accompanied by strong volume to confirm the bullish sentiment. A breakout with low volume could be a sign that the trend lacks conviction.
Conclusion
The Cup and Handle pattern is a powerful bullish chart formation in crypto that offers traders a clear indication of potential upward momentum. By recognizing the formation of the cup and the handle, waiting for the breakout, and using volume as confirmation, traders can increase their chances of successful trades. While it requires patience and attention to detail, the Cup and Handle pattern remains one of the most reliable patterns in the cryptocurrency market, helping traders identify the start of major uptrends.
Read more:
.png)


.jpg)