English
 Tiếng Việt
1. What are Bullish and Bearish Candles?
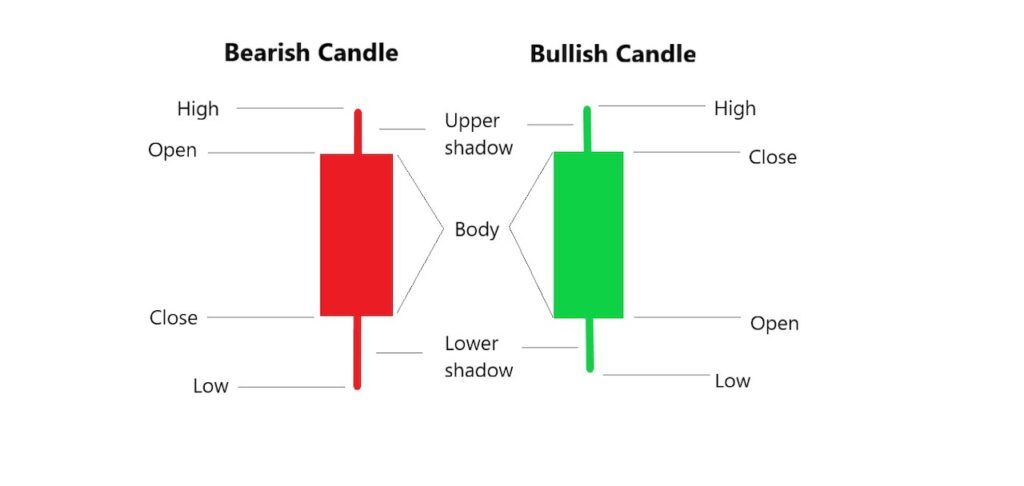
Candlestick charts are graphical representations of price movements over a specified period. Each candlestick consists of four key price points: the open, close, high, and low. The "body" of the candle represents the price range between the opening and closing prices, while the "wick" or "shadow" represents the price movement outside the open and close.
-
Bullish Candles: A bullish candle occurs when the closing price is higher than the opening price. It indicates that the market is in an upward momentum, and buyers are in control. This type of candle is usually colored green or white, depending on the charting software used.
-
Bearish Candles: A bearish candle occurs when the closing price is lower than the opening price. It suggests that the market is in a downward trend, and sellers have the upper hand. Bearish candles are often colored red or black.
2. How to Identify Bullish and Bearish Candles
.png)
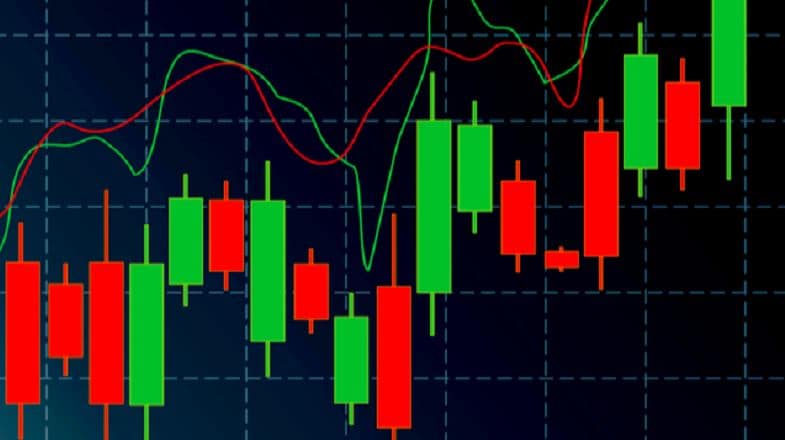
Identifying bullish and bearish candles is straightforward once you understand the basic structure of a candlestick. Here's how you can spot them:
-
Bullish Candlestick:
-
The body is hollow or filled with a light color (green or white).
-
The closing price is above the opening price.
-
The wick (or shadow) may be short or long, but the body should indicate upward price movement.
-
Bearish Candlestick:
-
The body is filled with a dark color (red or black).
-
The closing price is lower than the opening price.
-
The wick may be short or long, but the body reflects downward price movement.
3. Common Bullish and Bearish Candlestick Patterns
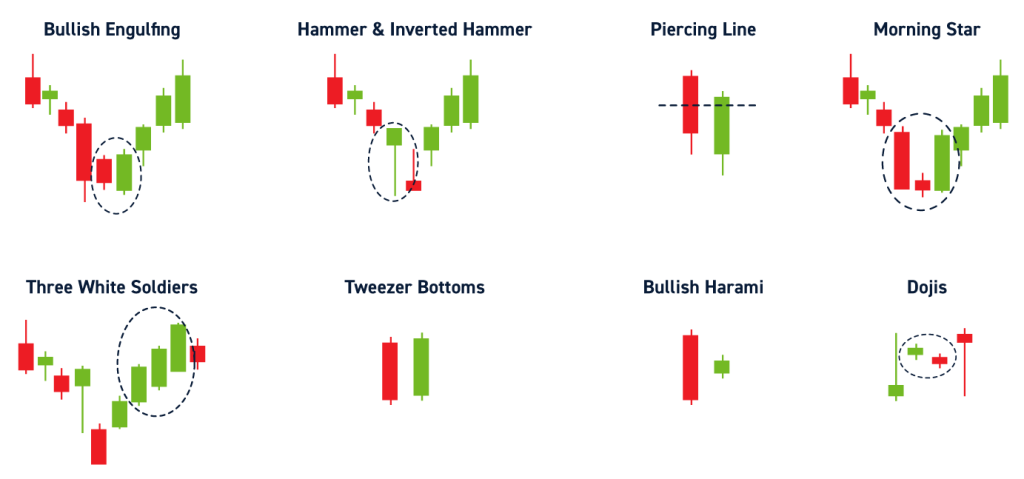
Traders often look for patterns in candlestick charts to predict future price movements. Here are some common bullish and bearish candlestick patterns:
Bullish Candlestick Patterns
-
Engulfing Pattern: A two-candle pattern where a small bearish candle is followed by a larger bullish candle that "engulfs" the previous one. This pattern indicates a strong reversal from a downtrend to an uptrend.
-
Hammer: A single candle with a small body and a long lower shadow. It suggests that despite selling pressure, buyers pushed the price back up, indicating potential bullish reversal.
-
Morning Star: A three-candle pattern consisting of a long bearish candle, followed by a small-bodied candle (often a doji), and then a long bullish candle. This pattern signals a reversal from bearish to bullish.
Bearish Candlestick Patterns
-
Engulfing Pattern: In the bearish version of this pattern, a small bullish candle is followed by a larger bearish candle that engulfs the previous one. It suggests that the market is shifting from an uptrend to a downtrend.
-
Shooting Star: This is a single candle with a small body and a long upper shadow. It appears after an uptrend and signals potential bearish reversal as it indicates that buying pressure has faded.
-
Evening Star: This three-candle pattern consists of a long bullish candle, followed by a small-bodied candle, and then a long bearish candle. The evening star pattern indicates a reversal from bullish to bearish.
4. How to use Bullish and Bearish Candles in Trading
Understanding bullish and bearish candles can significantly improve your trading strategy. Here’s how to incorporate them into your analysis:
-
Trend Confirmation: Use bullish and bearish candles to confirm the overall market trend. A series of consecutive bullish candles suggests an uptrend, while consecutive bearish candles indicate a downtrend.
-
Reversal Signals: Look for specific candlestick patterns, such as the hammer or engulfing pattern, to identify potential trend reversals. When a bearish trend is followed by a bullish reversal pattern (e.g., morning star), it could signal the start of an uptrend.
-
Entry and Exit Points: Bullish and bearish candles can help traders identify potential entry and exit points. For example, entering a trade after a bullish engulfing pattern could offer a favorable buying opportunity, while a shooting star after an uptrend may signal the time to sell.
-
Combining with Other Indicators: While candlestick patterns are powerful on their own, combining them with other technical indicators like moving averages, RSI, and MACD can help confirm signals and reduce the risk of false signals.
5. Why Bullish and Bearish Candles are important
-
Market Sentiment: Candles give traders an immediate view of the market's sentiment. Bullish candles indicate a strong buying presence, while bearish candles reflect selling pressure. By understanding this, traders can gauge the potential direction of the market.
-
Visual Simplicity: Candlestick charts are easy to interpret and provide a quick visual representation of price action. This makes them ideal for traders who need to make decisions quickly.
-
Predicting Price Movement: The shape and color of the candlesticks can often indicate whether the market will continue in its current direction or reverse. Recognizing patterns early can give traders a competitive edge.
6. Conclusion
Bullish and bearish candles are fundamental tools in technical analysis, offering valuable insights into market sentiment and price action. By understanding how to identify these candles and the patterns they form, traders can better predict market trends and make more informed trading decisions. Whether you're just starting or you're an experienced trader, mastering candlestick charting is essential for successful trading.
By recognizing the patterns and signals provided by bullish and bearish candles, you can enhance your trading strategies and increase your chances of success in the financial markets.
Read more:
.png)