English
 Tiếng Việt
1. What are Crypto Candlestick Charts?
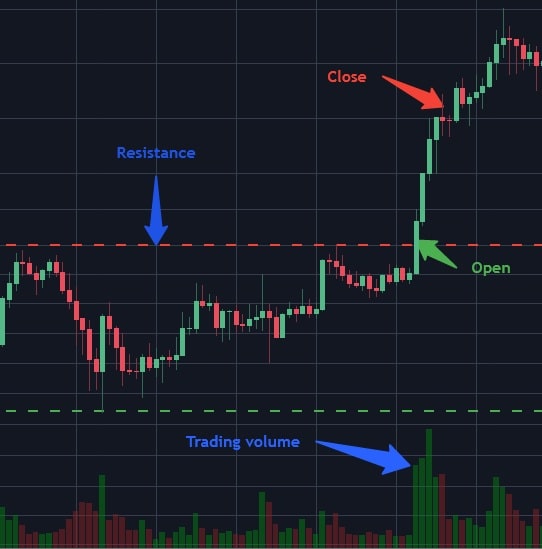
A crypto candlestick chart is a type of financial chart that displays the price movements of a cryptocurrency over a specific period. Each candlestick represents four key price points within a given time frame:
-
Open: The price at the beginning of the trading period.
-
Close: The price at the end of the trading period.
-
High: The highest price reached during the time frame.
-
Low: The lowest price during the time frame.
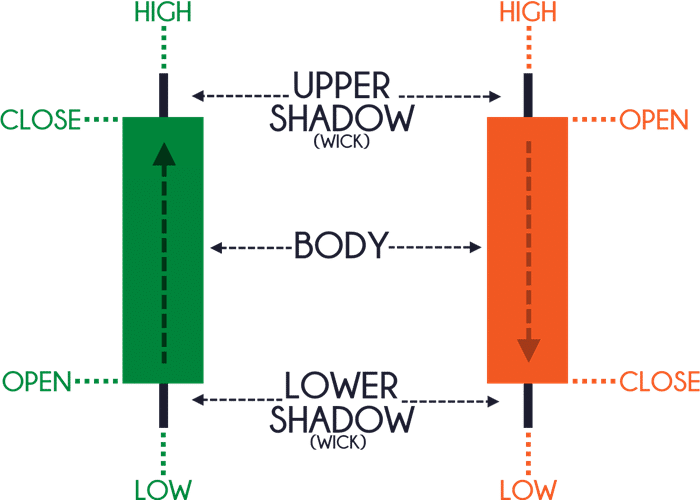
Each candlestick has a body and two "wicks" or "shadows." The body represents the range between the open and close prices, while the wicks show the highest and lowest prices during that period.
-
A bullish candle (typically green or white) indicates the closing price is higher than the opening price, suggesting upward price movement.
-
A bearish candle (typically red or black) means the closing price is lower than the opening price, suggesting downward price movement.
2. How to read Crypto Candlestick Charts
Reading crypto candlestick charts is essential for understanding market trends and making informed trading decisions. Here's how to interpret the candlesticks:
-
Bullish Candlestick (Green/White):
-
The close is above the open.
-
The price moved upward during the time period.
-
Indicates a buying pressure, where demand outstripped supply.
-
Bearish Candlestick (Red/Black):
-
The close is below the open.
-
The price moved downward during the time period.
-
Indicates selling pressure, where supply outstripped demand.
3. Key components of crypto candlesticks
-
Candlestick Body: The body of the candlestick represents the range between the open and close prices. A long body indicates strong price movement, while a short body indicates consolidation or indecision in the market.
-
Wicks/Shadows: The wicks extend from the body and show the highest and lowest prices reached during the period. A long wick may suggest a price reversal, while a short wick indicates little volatility.
-
The Upper Shadow: Represents the highest price during the period.
-
The Lower Shadow: Represents the lowest price during the period.
4. Common crypto candlestick patterns
.png)
Understanding crypto candlestick patterns is key to predicting future price movements. Certain patterns form over time, signaling potential trend reversals or continuations. Here are some common bullish and bearish candlestick patterns:
4.1 Bullish Patterns
Hammer:
-
A single candlestick with a small body and a long lower wick.
-
Indicates that selling pressure pushed the price lower, but buying pressure regained control by the close.
-
Suggests a potential reversal from a downtrend to an uptrend.
Bullish Engulfing:
-
A two-candle pattern where a small bearish candle is followed by a larger bullish candle.
-
The bullish candle "engulfs" the previous bearish candle, signaling a possible reversal to the upside.
Morning Star:
-
A three-candle pattern that starts with a long bearish candle, followed by a small-bodied candle (often a doji), and a long bullish candle.
-
Indicates a potential reversal from bearish to bullish.
4.3 Bearish Patterns
Shooting Star:
-
A single candlestick with a small body and a long upper wick.
-
Appears after an uptrend, signaling that the price is reaching a potential top and a reversal to the downside may occur.
Bearish Engulfing:
-
A two-candle pattern where a small bullish candle is followed by a larger bearish candle.
-
The bearish candle "engulfs" the previous bullish candle, signaling a potential bearish reversal.
Evening Star:
-
A three-candle pattern that starts with a long bullish candle, followed by a small-bodied candle, and ends with a long bearish candle.
-
Indicates a potential reversal from bullish to bearish.
5. How to Use Crypto Candlestick Patterns in Trading
Crypto candlestick charts are a powerful tool for identifying trends and making informed trading decisions. Here’s how you can use them effectively:
Identify Trends
-
Use candlestick charts to determine the overall trend of a cryptocurrency. A series of bullish candlesticks indicates an uptrend, while consecutive bearish candles suggest a downtrend.
Spot Reversals
-
Look for candlestick reversal patterns, such as hammers or engulfing patterns, to identify potential trend reversals. For example, a hammer after a downtrend could signal a bullish reversal, while a shooting star after an uptrend may indicate a bearish reversal.
Find Entry and Exit Points
-
Candlestick patterns can help you decide when to enter or exit a trade. For example, entering after a bullish engulfing pattern might offer a favorable buying opportunity, while exiting a trade after a shooting star pattern could help you lock in profits before a potential downtrend.
Combine with Other Indicators
-
Use candlestick patterns in conjunction with other technical analysis tools such as Moving Averages, RSI, and MACD to confirm signals and reduce the risk of false alarms. A combination of indicators can give you more confidence in your trade decisions.
6. Conclusion
Crypto candlestick charts are essential tools for traders looking to analyze price movements and make better trading decisions. By understanding how to read and interpret these charts, you can spot potential reversals, trends, and key entry/exit points in the crypto market.
Whether you're a beginner or an experienced trader, mastering crypto candlestick patterns will enhance your ability to predict market movements and improve your chances of success in the highly volatile cryptocurrency market.
By incorporating candlestick chart analysis into your trading strategy, you can gain a deeper understanding of market sentiment and better manage risk.
Read more:
.png)