Tiếng Việt
1. What is a BTC Liquidation Map?
A BTC Liquidation Map is a real-time visualization tool that highlights where significant liquidations occur in the Bitcoin market. These maps utilize data from exchanges to identify price points at which leveraged positions—whether long or short—are forcibly closed due to insufficient margin.
1.1. The Mechanics of Liquidation
Liquidation occurs when a leveraged position is automatically closed by the exchange to prevent further losses. This process is triggered when the market price moves against the trader's position, resulting in insufficient collateral.
-
Long Liquidations: Positions betting on price increases are liquidated when the price drops significantly.
-
Short Liquidations: Positions betting on price decreases are liquidated when the price rises unexpectedly.
BTC Liquidation Maps visualize these events, enabling traders to spot patterns and prepare for potential price movements.
1.2. Why Liquidation matters in Crypto Trading
Liquidations play a significant role in market volatility. Large-scale liquidations often trigger cascading price movements, creating opportunities for profit but also increasing risk.
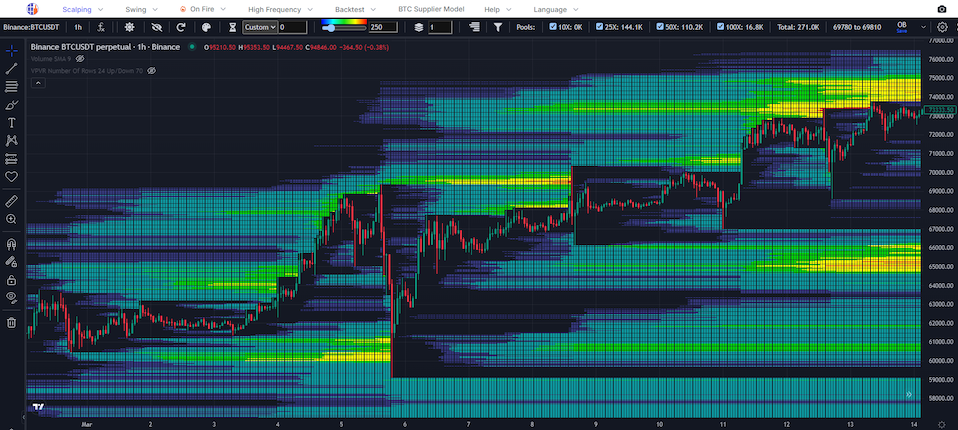
2. Understanding the BTC Liquidation Heatmap
.png)
BTC Liquidation Heatmaps display liquidation data in a color-coded format to indicate areas of high or low liquidation activity.
2.1. Color Coding and Interpretation
-
Red Zones: Indicate a high density of liquidations. These areas often precede sharp price movements as cascading liquidations create significant market shifts.
-
Blue/Green Zones: Represent areas of lower liquidation density, typically associated with stable price movements.
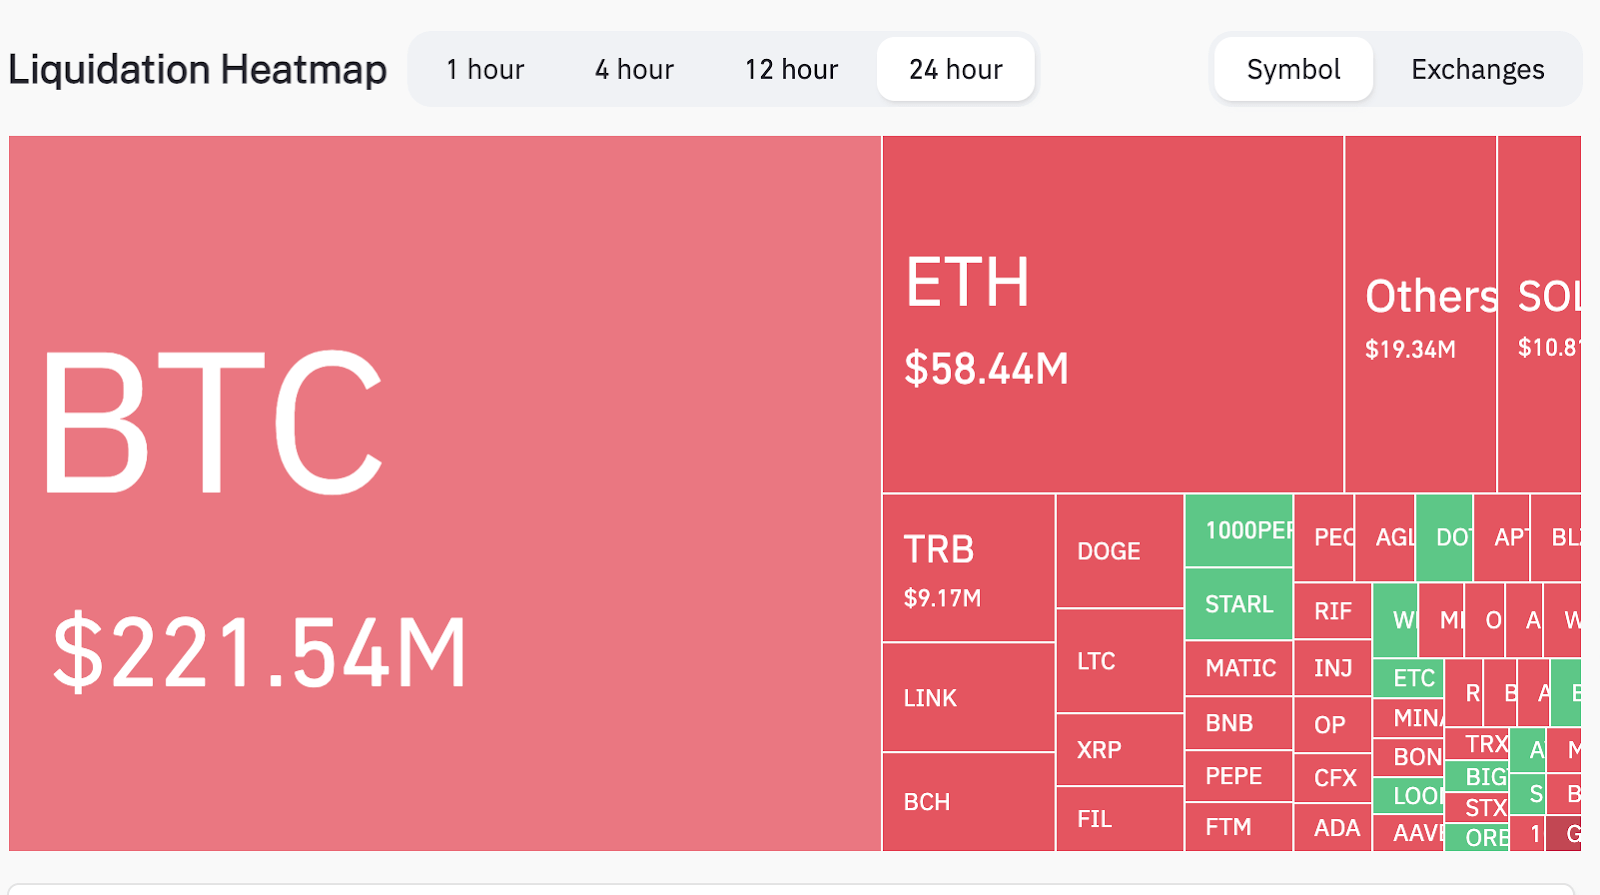
For example, during a price dip to $26,500 in early 2025, Bitcoin liquidations hit $300 million within 24 hours, leading to a short-term crash reflected on the heatmap as intense red zones.
2.2. Identifying Market Trends
Liquidation maps help traders identify critical support and resistance levels. For instance, in March 2024, a large liquidation cluster formed around $28,000, marking a key resistance point that subsequently led to a drop to $26,500.
3. How to Read and Use a BTC Liquidation Map
3.1. Interpreting Heatmap Data
-
Warm Colors (Red/Orange): Signal intense liquidation zones. Approaching these areas often triggers price reversals or continuations.
-
Cool Colors (Blue/Green): Indicate areas of low liquidation activity, representing relative market stability.
3.2. Timing Trades
Traders can time their entries and exits based on liquidation clusters. For instance, a cluster of long liquidations may signal a shorting opportunity, while concentrated short liquidations could indicate a potential rally.
3.3. Monitoring Real-Time Updates
BTC Liquidation Maps are updated in real-time, allowing traders to adapt to sudden market shifts. For example, in February 2024, a sharp decline in Bitcoin’s price from $40,000 to $36,000 triggered $100 million in liquidations, emphasizing the importance of staying informed.
3.4. Identifying Overextended Markets
When liquidation levels in one direction dominate, it signals that the market may be overextended and poised for a reversal.
4. Applications of BTC Liquidation Maps in Trading
BTC Liquidation Maps serve as a dynamic tool for both experienced traders and newcomers. By offering clear insights into where liquidations occur, they provide a strategic edge in various trading scenarios. Here’s a detailed breakdown of how traders can apply this data effectively:
4.1. Timing Entries and Exits
Understanding where significant liquidation clusters form can help traders time their market positions:
-
Entry Points: When a cluster of short liquidations is observed, it might signal a potential price rally, making it an ideal time to enter a long position. Conversely, a large cluster of long liquidations may hint at a bearish move, suggesting a short position.
-
Exit Points: Traders can use liquidation data to identify areas where price reversals are likely to occur, enabling more precise exits. For example, if a liquidation cluster is observed near a resistance level, it might be prudent to exit a long position.
4.2. Risk Mitigation
Liquidation maps help traders avoid zones of extreme volatility where price movements can be unpredictable:
-
Stop-Loss Adjustment: By identifying clusters of potential liquidation, traders can strategically place stop-loss orders to avoid being liquidated themselves.
-
Avoiding Leverage Traps: In high-volatility zones, the risk of leveraged trades increases. Liquidation maps provide a warning signal, allowing traders to adjust leverage or stay out of risky trades.
4.3. Spotting Market Manipulation
Large players or "whales" often exploit liquidation zones to move the market in their favor. Traders using liquidation maps can:
-
Identify Manipulation Patterns: Sudden spikes in liquidations at specific levels may indicate intentional market moves by large players.
-
Counteract Whale Strategies: By recognizing these patterns, retail traders can adjust their strategies to avoid losses caused by artificial price swings.
4.4. Identifying Overextended Markets
An overextended market often precedes a reversal:
-
Short Squeeze: If the map shows a high concentration of short liquidations, it could indicate an upcoming bullish reversal as shorts are forced to close their positions.
-
Long Squeeze: Similarly, an excessive number of long liquidations might signal a bearish correction due to overleveraging in long positions.
5. Limitations of BTC Liquidation Maps
While BTC Liquidation Maps are powerful tools, they are not without limitations. Traders must remain aware of these to avoid overreliance on the tool:
5.1. Data Accuracy and Delays
-
Exchange Dependency: Liquidation maps rely on data from exchanges. If the data is inaccurate, delayed, or incomplete, it may lead to poor decision-making.
-
Latency Issues: In a fast-moving market, even minor delays in data updates can render the information obsolete.
5.2. Over-Simplification of Market Dynamics
-
Complex Variables: The market is influenced by various factors such as news, macroeconomic trends, and institutional trading behavior. Liquidation maps focus solely on one aspect, which can lead to a narrow interpretation of market conditions.
-
False Signals: Not all liquidation clusters lead to significant price movements. Relying solely on these maps may result in missed opportunities or unnecessary trades.
5.3. Overdependence on Visual Data
-
Neglecting Broader Analysis: Traders who over-rely on liquidation maps may overlook other critical analytical tools, such as order books, on-chain metrics, or technical indicators.
-
Psychological Bias: The visual nature of heatmaps can create confirmation bias, where traders see what they expect rather than objectively analyzing the data.
6. Leading Platforms Offering BTC Liquidation Maps
.png)
Several platforms specialize in providing high-quality BTC Liquidation Maps, each with unique features catering to different trading needs. Below is a detailed overview of the top options:
6.1. Coinglass
Overview:
Coinglass (formerly Bybt) is a popular platform offering a variety of data tools, including liquidation heatmaps. It aggregates data from major exchanges like Binance, Bitfinex, and OKX.
Features:
-
Comprehensive Exchange Data: Access liquidation data from multiple exchanges in real-time.
-
Interactive Visualizations: Easily track liquidation clusters with user-friendly charts.
-
Custom Alerts: Set alerts for specific liquidation levels or zones.
Use Case:
Traders looking for detailed liquidation data across multiple platforms can use Coinglass for cross-exchange analysis, helping them make more informed decisions.
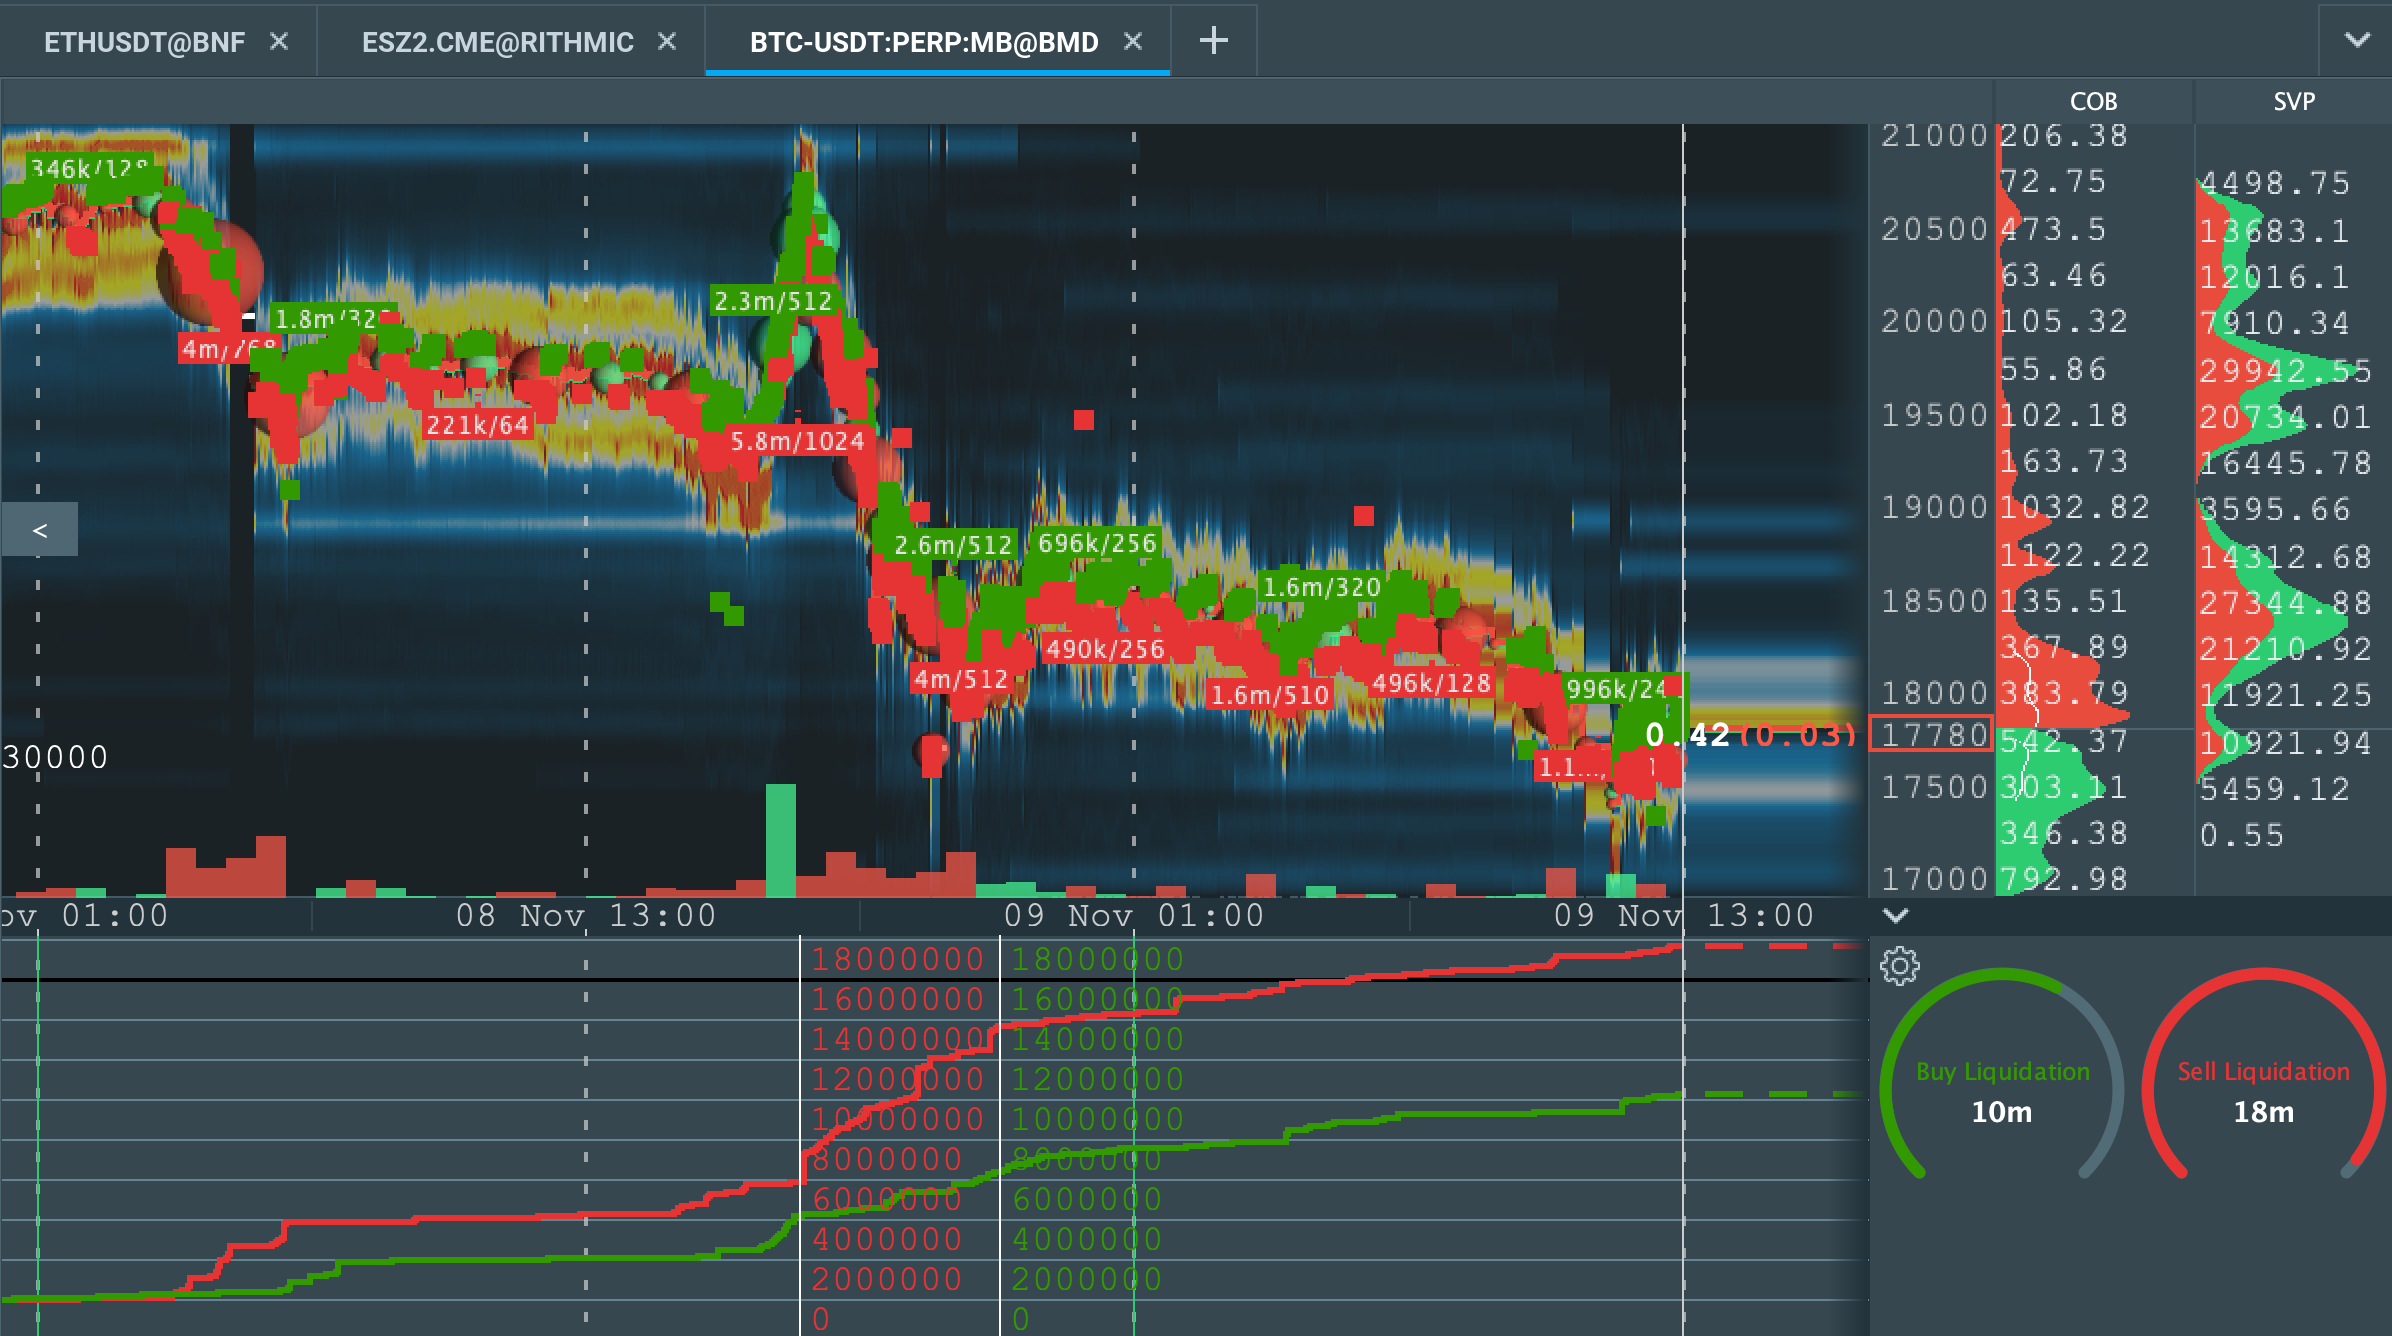
6.2. TensorCharts
Overview:
TensorCharts combines BTC liquidation maps with additional market metrics, such as order flow and market depth, offering advanced analytics for experienced traders.
Features:
-
Order Flow Integration: Visualize market orders alongside liquidation data for deeper insights.
-
Customizable Heatmaps: Adjust settings to focus on specific price levels or liquidation intensities.
-
Volume Profile: Analyze the volume distribution to identify significant support and resistance zones.
Use Case:
TensorCharts is ideal for professional traders who require a comprehensive view of market dynamics, including how liquidation events align with other market trends.
6.3. Zoomex
Overview:
Zoomex is gaining traction as a go-to platform for Bitcoin liquidation data, thanks to its intuitive interface and real-time updates.
Features:
-
Live Liquidation Tracking: Provides immediate updates on significant liquidation events.
-
Beginner-Friendly Design: Offers simple navigation and clear visualizations, making it accessible to traders of all levels.
-
Exchange-Specific Data: Focuses on liquidations within Zoomex’s ecosystem, ensuring precise data for its users.
Use Case:
Zoomex is a great choice for traders seeking a streamlined experience and those new to using liquidation maps in their strategies.
Conclusion
BTC Liquidation Maps are indispensable for traders navigating Bitcoin’s volatile market. By visualizing liquidation clusters, traders can:
-
Identify entry and exit points.
-
Spot market manipulation and overextended conditions.
-
Mitigate risks by avoiding high-volatility zones.
However, traders should remember that liquidation maps are not a standalone solution. Combining them with broader analytical tools and staying informed about market conditions will yield the best results. Platforms like Coinglass, TensorCharts, and Zoomex make this tool accessible, empowering traders to make smarter, data-driven decisions in an ever-changing market.
Read more:
.png)